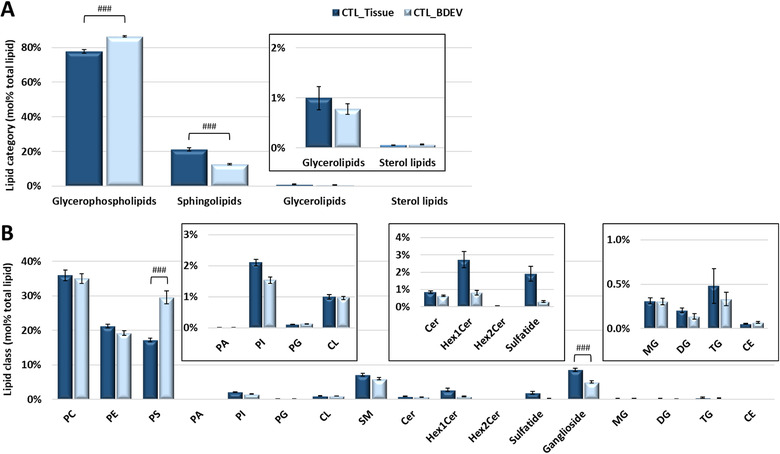
FIGURE 2.

Comparison of total lipid abundance between frontal cortex and the BDEVs in this tissue from control subjects. [(A) Mol% total lipid abundance distributions at the lipid category level. Four lipid categories, covering glycerophospholipids (GPs), sphingolipids (SPs), glycerolipids (GLs) and sterol lipids (STs) were included in this study. The inset shows the low abundant GL and ST categories for clarity. BDEVs contained significantly higher levels of GPs and corresponding lower levels of SPs in comparison to tissue. (B) Mol% total lipid abundance distributions at the lipid class level. A total of 17 lipid classes were identified in this study. The inset shows the low abundant PA, PI, PG, CL, Cer, Hex1Cer, Hex2Cer, sulfatide, MG, DG, TG and CE classes for clarity. BDEVs were found to be significantly enriched in PS lipids, making up approx. 30% of the total lipid abundance, compared to tissue (approx. 17%). Ganglioside lipids were significantly downregulated in BDEV compared to tissue. Data represent the average mol% total lipid abundances ± standard error of the mean. Statistical significance was determined by ANOVA followed by Sidak's multiple comparison test, with multiplicity adjusted p value < 0.01. ### Adjusted P value < 0.0001. CTL = control, BDEV = brain derived extracellular vesicles. N = 8 CTL subjects]
