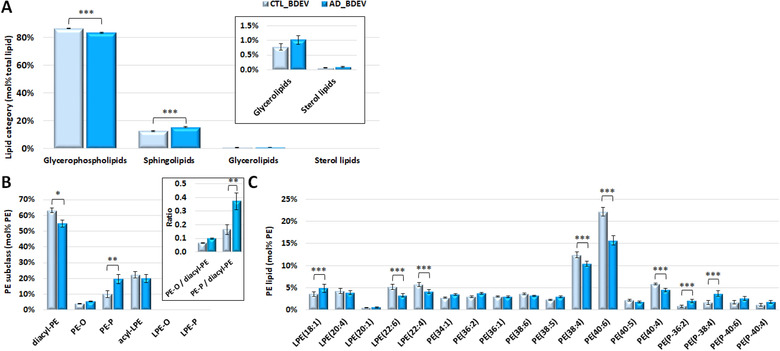
FIGURE 4.

Comparison of mol% total lipid abundance differences between BDEV from control versus Alzheimer's disease tissue. [(A) Mol% total lipid abundance distributions at the lipid category level. Four lipid categories, covering glycerophospholipids (GPs), sphingolipids (SPs), glycerolipids (GLs) and sterol lipids (STs) were included in this study. The inset shows the low abundant GL and ST categories for clarity. GPs were significantly decreased in AD vs. CTL BDEV, with a corresponding significant increase in SPs. (B) Mol% total PE lipid subclass abundance distributions. Diacyl‐PE was decreased and PE‐P was increased in AD BDEV. The inset shows the ratio of PE‐O and PE‐P to diacyl PE and a significant shift from diacyl‐PE towards PE‐P in AD. (C) Mol% total PE lipid abundance distributions of individual PE molecules. LPE(18:1) was increased in AD relative to CTL. A group of polyunsaturated fatty acid (PUFA) containing PE molecules, including LPE(22:6), LPE(22:4), PE(38:4), PE(40:6) and PE(40:4), were significantly decreased in AD. A group of the most abundant PE‐P lipids, including PE(P‐36:2) and PE(P‐38:4), was significantly increased in AD. Only the most abundant lipid molecules in each lipid class are shown for clarity. Data represent the average mol% total lipid class abundance ± standard error of the mean. Statistical significance was determined by ANOVA followed by Sidak's multiple comparison test, with multiplicity adjusted P value < 0.01. * Adjusted P value < 0.01, ** adjusted P value < 0.001, and *** adjusted P value < 0.0001. CTL, control; AD, Alzheimer's disease; BDEV, brain derived extracellular vesicles. N = 8 AD subjects and N = 8 CTL subjects]
