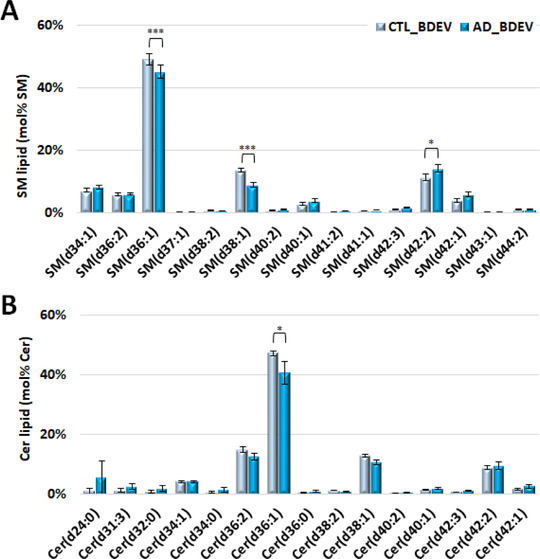
FIGURE 5.

Comparison of SM and Cer individual lipid molecules (mol% class) of BDEV from control versus Alzheimer's disease tissue. [(A) Mol% total SM lipid class abundance distributions. Significant decreases in SM(d36:1) and SM(d38:1), accompanied with an increase in SM(d42:2), predominantly the SM(d18:1_24:1) species, were observed in AD vs. CTL BDEV. (B) Mol% total Cer lipid class abundance distributions. Cer(d36:1) was found significantly lower in AD vs. CTL BDEV. Only the most abundant lipid molecules in each lipid class are shown for clarity. Data represent the average mol% total lipid class abundance ± standard error of the mean. Statistical significance was determined by ANOVA followed by Sidak's multiple comparison test, with multiplicity adjusted P value < 0.01. * Adjusted P value < 0.01, ** adjusted P value < 0.001, and *** adjusted P value < 0.0001. CTL, control; AD, Alzheimer's disease; BDEV, brain derived extracellular vesicles. N = 8 AD subjects and N = 8 CTL subjects]
