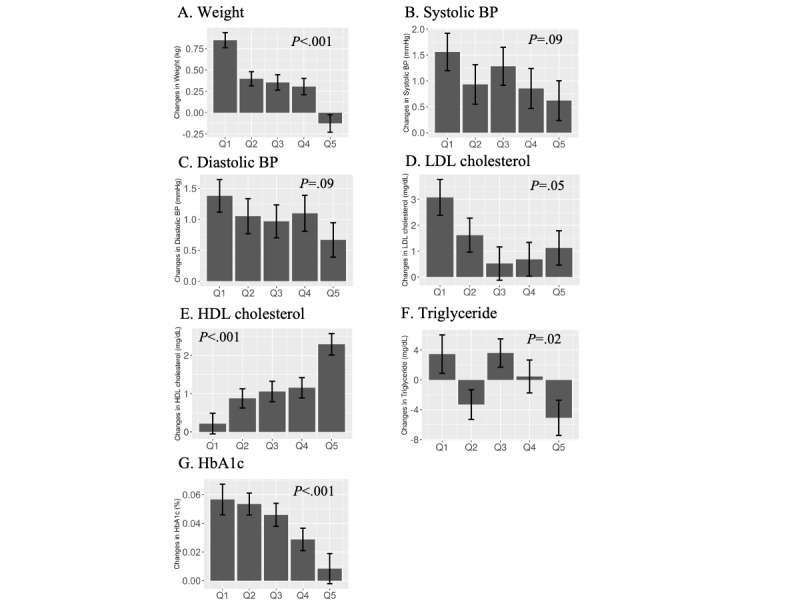
Figure 5.

Changes in CVD biomarkers among users according to the changes in daily step count. Changes in CVD biomarkers following kencom registration (follow-up data minus baseline data) were compared according to the quintile of the changes in the user’s step count (corresponding to Q1 to Q5 in the x-axis). Bars represent the average changes in the biomarker in each unit and the error bars indicate the standard errors. P values are for the linear trend. BP: blood pressure; CVD: cardiovascular disease; HbA1c: hemoglobin A1c; HDL: high-density lipoprotein; LDL: low-density lipoprotein.
