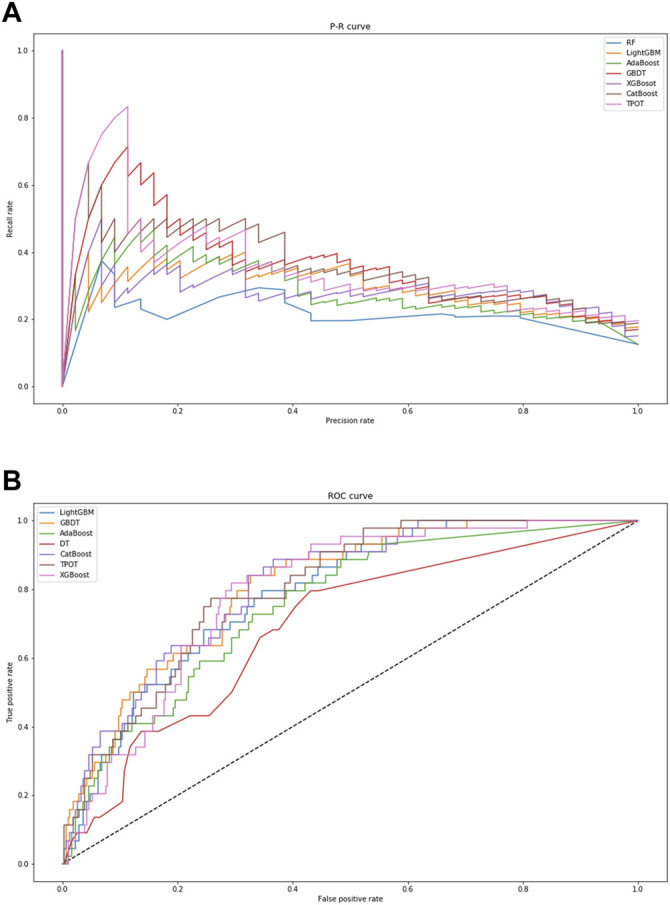
FIGURE 3.

Visual presentation of model performance based on seven algorithms. (A) displays the precision–recall curve. (B) displays the ROC curve. When the area under curve is closer to “1,” the performance of model classification and prediction is better. Abbreviations: RF, Random Forest; GBDT, Gradient Boosting Decision Tree; XGBoost, eXtreme Gradient Boosting.
