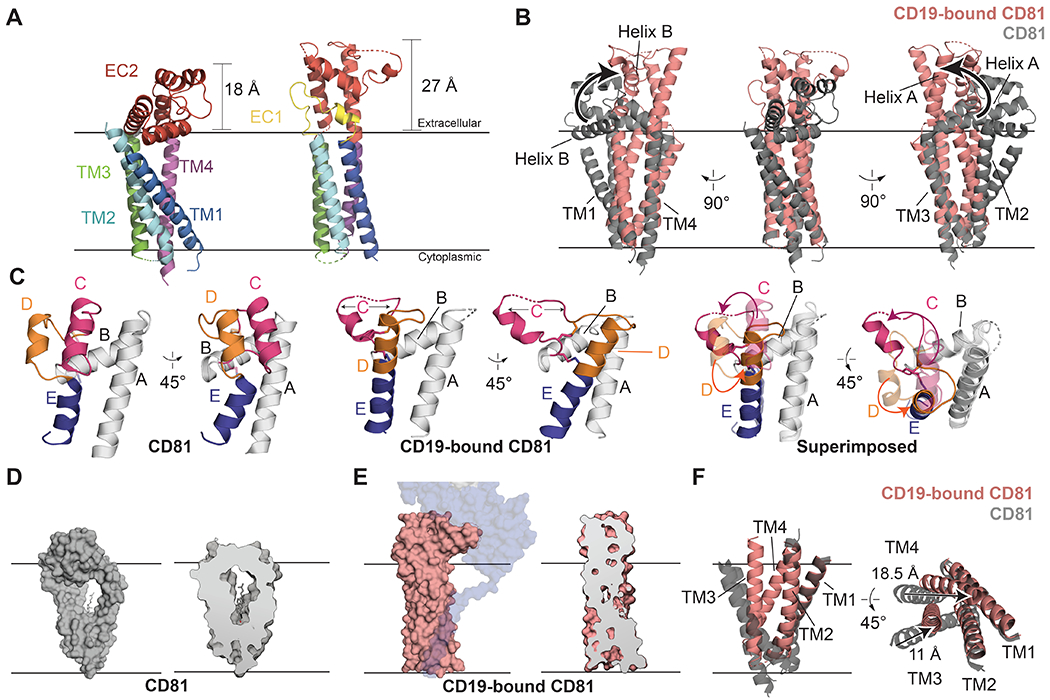
Fig. 2. Comparison of apo-CD81 and CD19-CD81 complex structures.

(A) Comparison of apo-CD81 (left) with complexed CD81 (right). The structures are aligned on the TM3/TM4 helices and colored by domain. (B) Overlay of apo-CD81 on complexed CD81. Structures were aligned on the TM3/4 helices. Helices A and B of the large extracellular loop (EC2) are highlighted to show the hinge-opening movement of the ectodomain. (C) Comparison of the large extracellular loops of apo-CD81 (left) and complexed CD81 (middle), and superposition of the two conformations (right). Helices C-E are colored. In the superposition, the large extracellular loop of complexed CD81 is solid, and apo-CD81 is transparent. (D) Surface representation of apo-CD81 (left) and cross-section highlighting cholesterol binding pocket (right). (E) Surface representation of complexed CD81 (left) and cross-section highlighting the occlusion of the cholesterol binding pocket (right). CD81 was modeled was side chains in the transmembrane domain for Panel E. (F) Overlay of the transmembrane region of apo-CD81 on complexed CD81, aligned on the TM1/2 helices. Movements within the transmembrane domain are indicated with black arrows. See also Supplementary Video S1.
