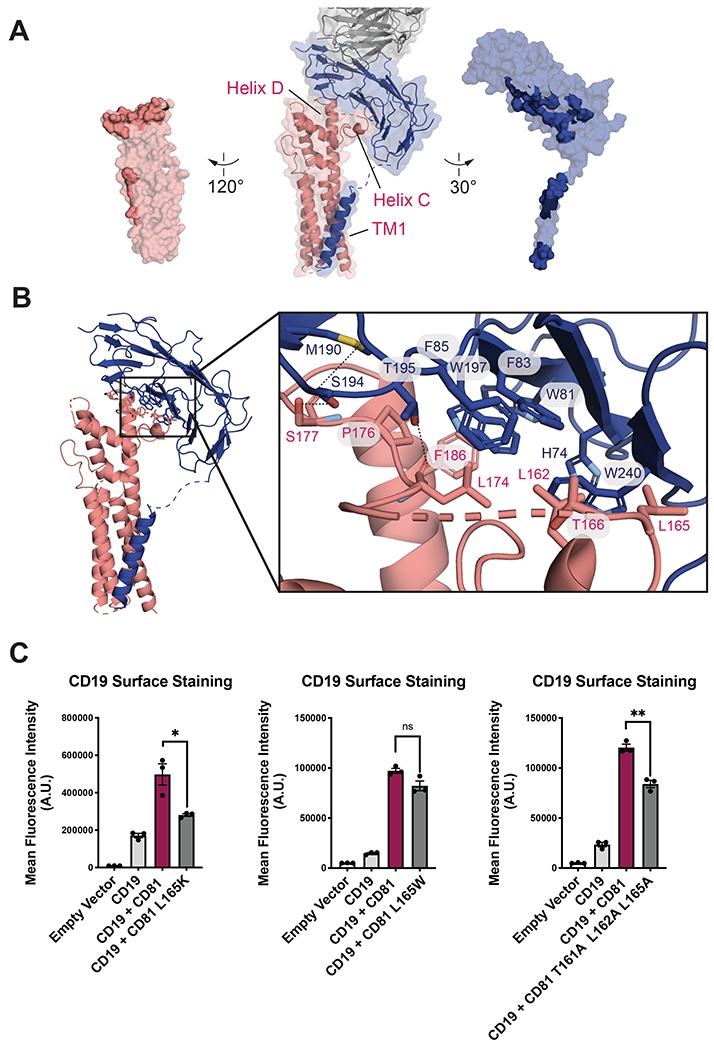
Fig. 3. CD19-CD81 interface.

(A) Open book representation of the CD19-CD81 interface. CD81 is salmon, CD19 is blue, and the Fab is grey. Residues at the binding interface are colored in a darker shade. (B) CD19-CD81 binding interface. Zoomed in views show hydrogen bonds and van der Waals interactions with dotted lines. (C) Effect of CD81 interface mutations on CD19 export. Surface CD19 was detected by flow cytometry using an Alexa 488-coupled anti-CD19 antibody. Expression of CD81 mutants was confirmed by flow cytometry (Figure S7). Error bars represent mean ± SEM of three independent experiments. Statistical analysis was performed in GraphPad Prism using an unpaired t test. *p ≤0.05; **p ≤ 0.01; ***p ≤ 0.001.
