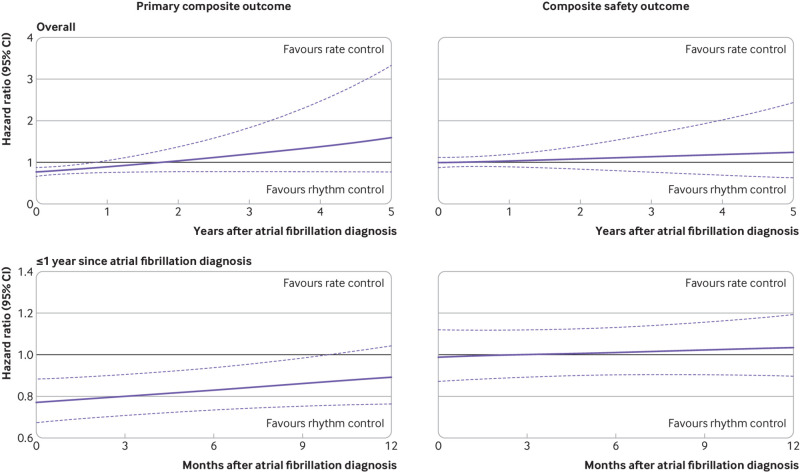
Fig 8.
Relation between treatment timing and risk of clinical outcomes for rhythm control or rate control in the overall period and within one year after the first diagnosis of atrial fibrillation. The y axis shows hazard ratios associated with rhythm control compared with rate control. The black horizontal lines indicate a hazard ratio of 1, corresponding to an equal risk of outcomes in patients treated with rhythm and rate control. Dashed purple lines show the 95% confidence interval (CI)

