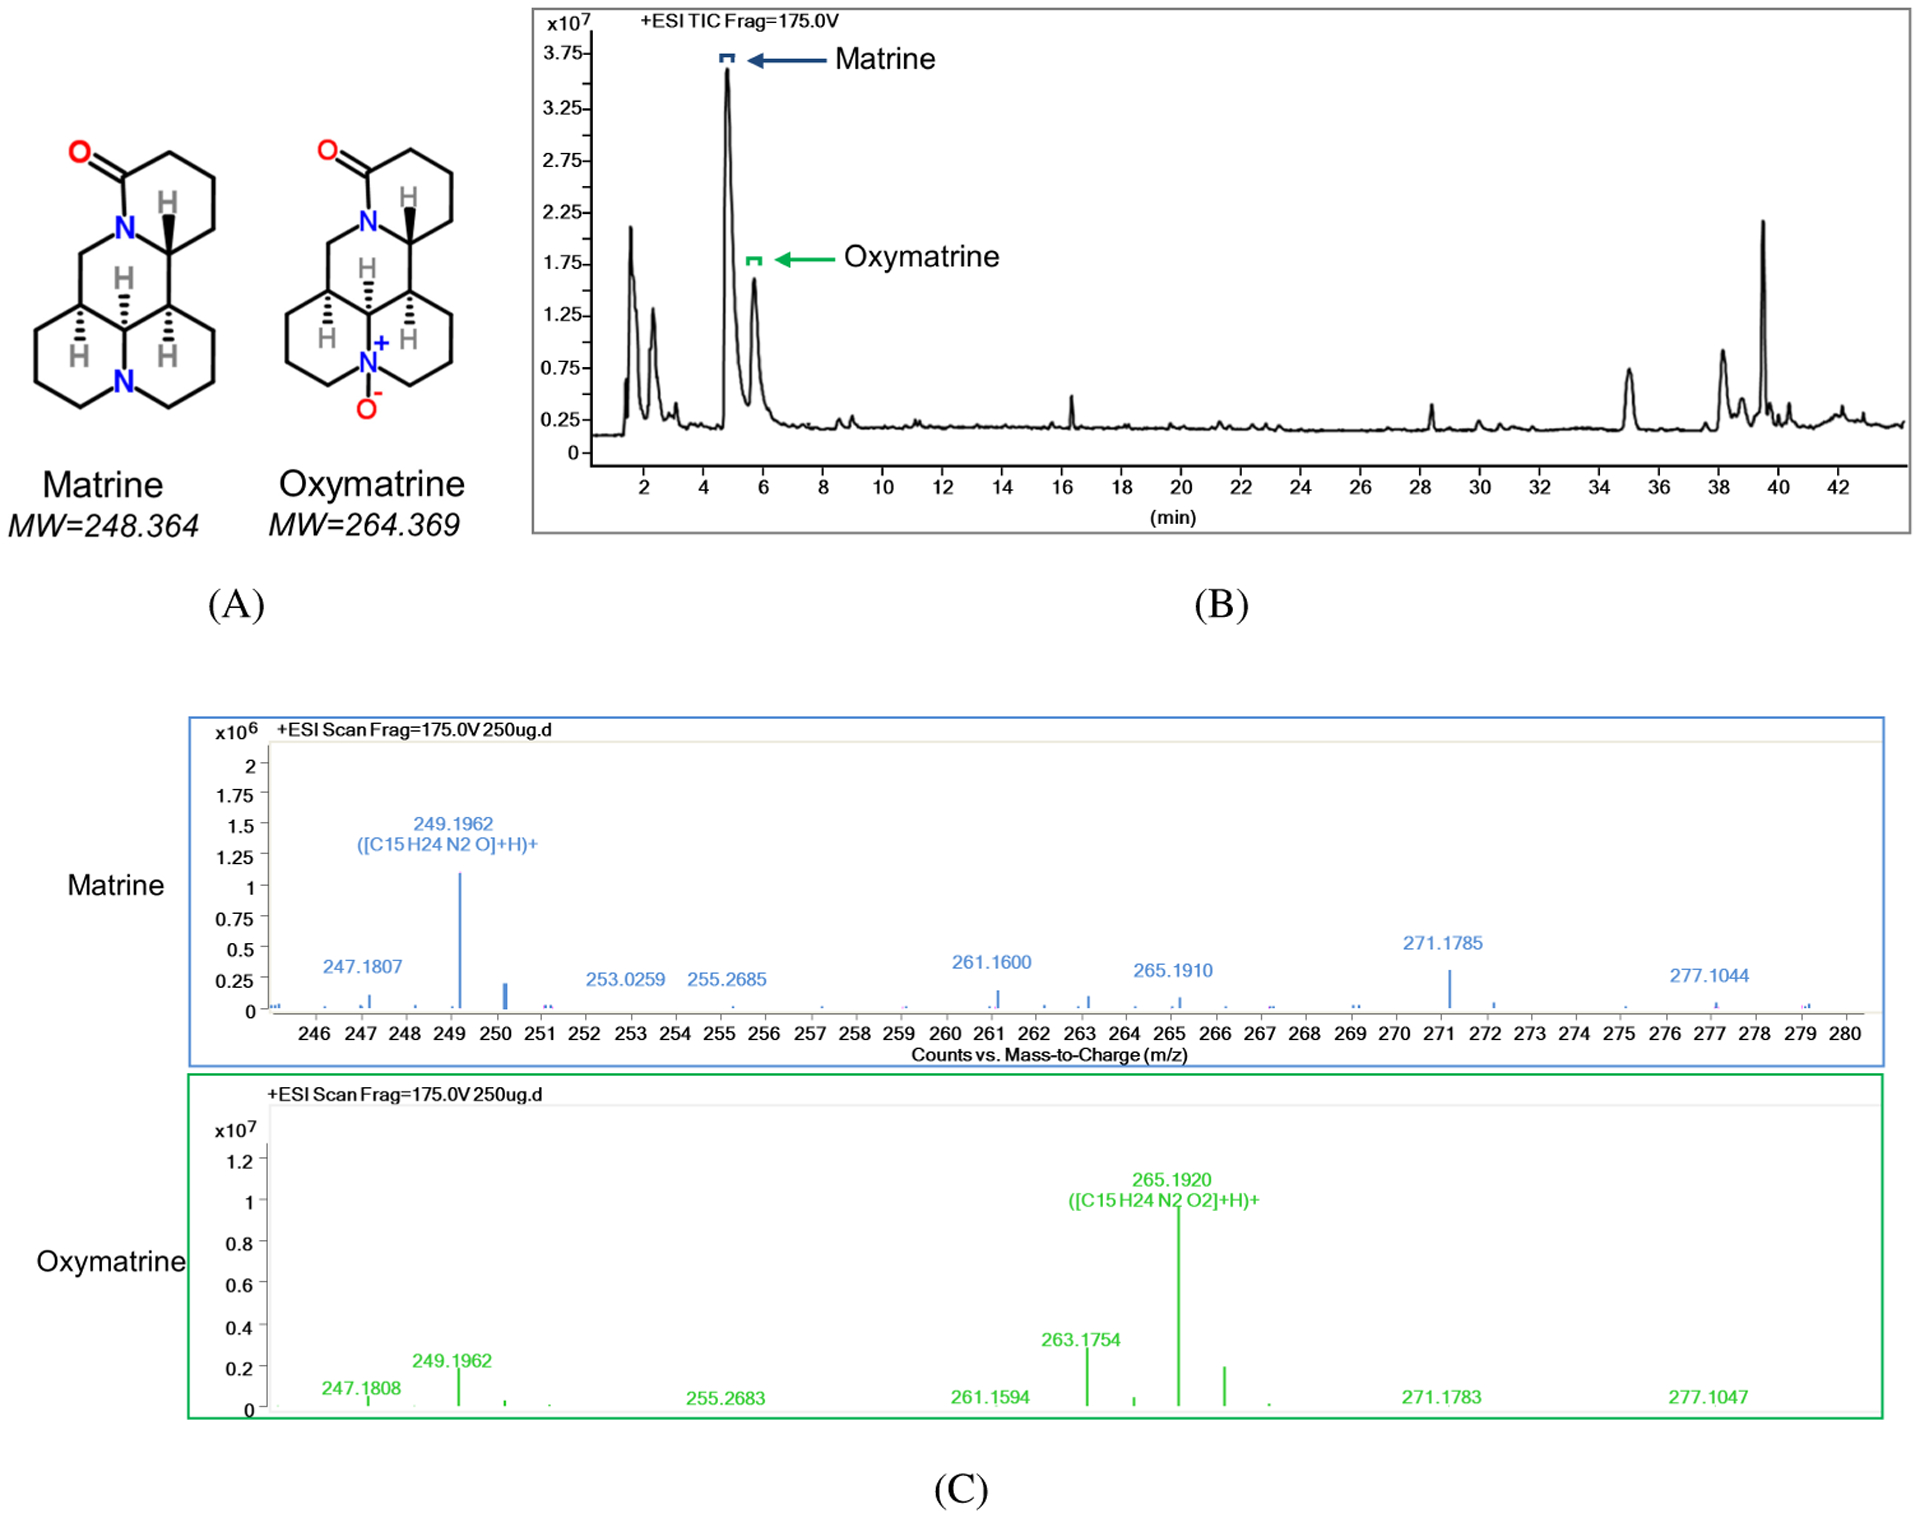
Figure 1.

The matrine and oxymatrine contents in QYJD. (A) The molecular structure and molecular weight of matrine and oxymatrine. (B) LC/MS chromatogram of QYJD. The peaks for matrine and oxymatrine are indicated by an arrow. Top square brackets indicate the range of peaks for displaying the mass spectra. (C) Mass spectra of matrine (upper) and oxymatrine (lower). The mass-to-charge (m/z) ratios of all detected peaks are shown above each peak.
