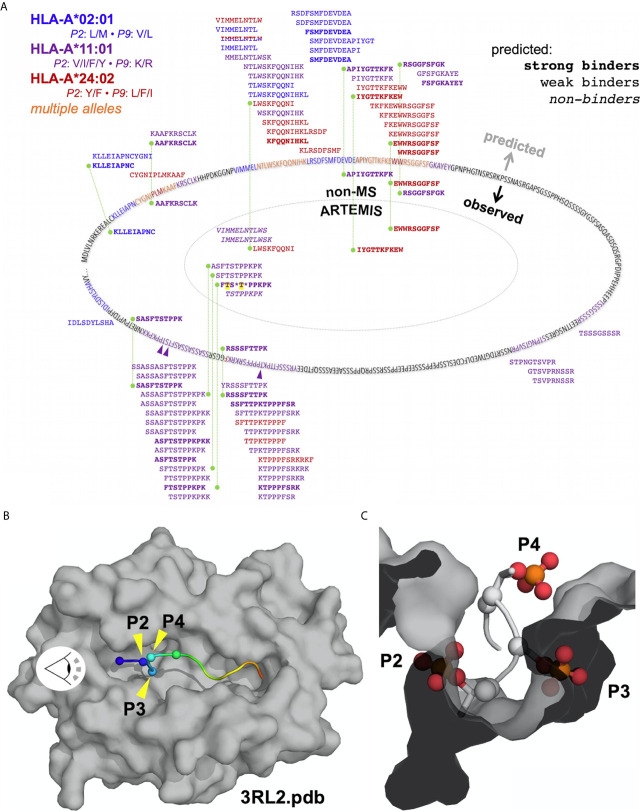
Figure 10.
Mapping ARTEMIS-identified peptides onto the LT sequence. (A) The sequence of the truncated form of MCV LT associated with cancer is shown mapped onto an oval. Residues in ARTEMIS-identified peptides are colored as indicated; phosphorylated threonine residues are marked with purple arrows. LT peptides predicted by NetMHCpan to bind to A2, A11, or A24 are shown around the outside of the oval, approximately positioned by their location in the sequence. Predicted strong binders are shown in bold, peptides predicted not to bind are shown in italics. Peptides identified by non-MS experimental methods are shown inside the sequence oval but outside the dotted line, colored by allele as indicated. All of these peptides are predicted to bind strongly to their cognate alleles. ARTEMIS-identified peptides are shown inside the dotted line, colored by cognate allele as indicated, with predicted binding/non-binding behavior shown in bold or italics. Phosphorylated residues in ARTEMIS-identified peptides are indicated by asterisks; threonines phosphorylated in LT in ARTEMIS-identified peptides are highlighted in yellow. Green dashed lines connect peptides identified by more than one method. (B) The crystal structure of A11 PDB accession code 3RL2 (51) is shown as a molecular surface, colored gray, with the backbone of the bound peptide shown in a cartoon representation, colored from blue to red, N- to C-terminus. The α-carbons of the first four residues in the peptide (P1 through P4) are marked with spheres. The eye symbol indicates the viewpoint shown in (C). (C) A view down the peptide binding groove of A11 from the perspective indicated in (B). Phosphothreonine residues have been modeled into the P2 and P4 positions, and a phosphoserine has been modeled into the P3 position. Phosphate groups have been shown in a ball-and-stick representation, colored by atom type.

