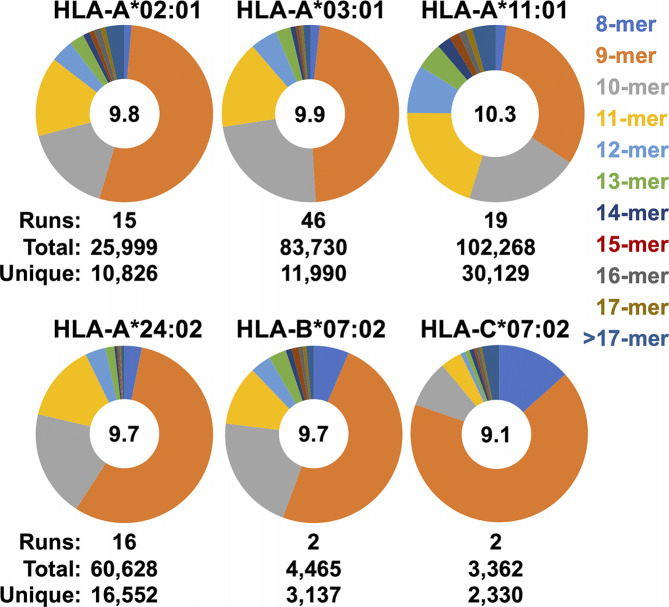
Figure 6.
Observed peptide length distributions recovered from SCDs by allele. The length distributions of peptides from merged SCD analyses across multiple replicates are displayed as pie charts. SCD allele and peptide length are shown as indicated. Numbers of replicates (“runs”), total peptides observed, and the number of unique peptides in the union datasets are indicated. Average peptide length across the merged datasets is shown in the in the center of each pie.

