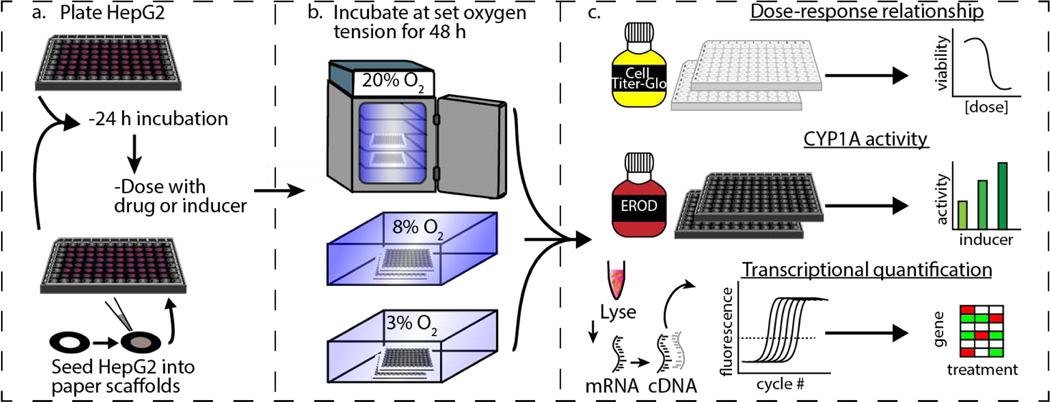
Figure 1.
Experimental workflow comparing the responses of HepG2 cells exposed to different oxygen tensions. Cell monolayers were maintained on standard culture plasticware. The 3D cultures were prepared by seeding cells suspended in a collagen I matrix into wax-patterned paper scaffolds. (a) First, cells were placed in the appropriate culture format and incubated for 24 h at atmospheric culture conditions (20% O2, 5% CO2, and 37 °C). (b) Next, the cells were incubated in the presence of a drug or inducer for 48 h at 20%, 8%, or 3% O2. (c) Finally, cellular responses were quantified. Hepatotoxicity was evaluated with the CellTiter-Glo viability assay, CYP1A activity quantified with the EROD assay, and transcriptional regulation was determined with RT-qPCR.

