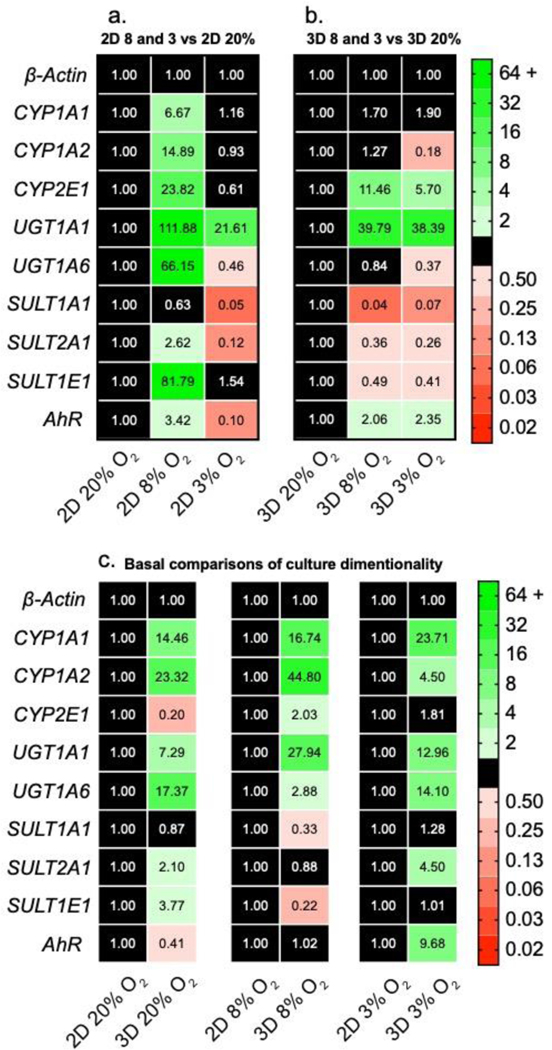
Figure 4.
Transcript-level regulation of phase I and phase II drug-metabolizing enzymes in HepG2 (a) monolayer and (b) 3D cultures after a 48 h exposure to 20%, 8%, or 3% O2. (c) Transcript-level regulation between monolayer and 3D culture formats at each oxygen tension. Each value is the average of at least two cell passages (N=2–3); each pass contained at least three technical replicates (n=3). A fold-change >2 indicates a significant increase in expression; <0.50 indicates a significant decrease. The numerical values correspond to the average ΔΔCt value of each transcript.

