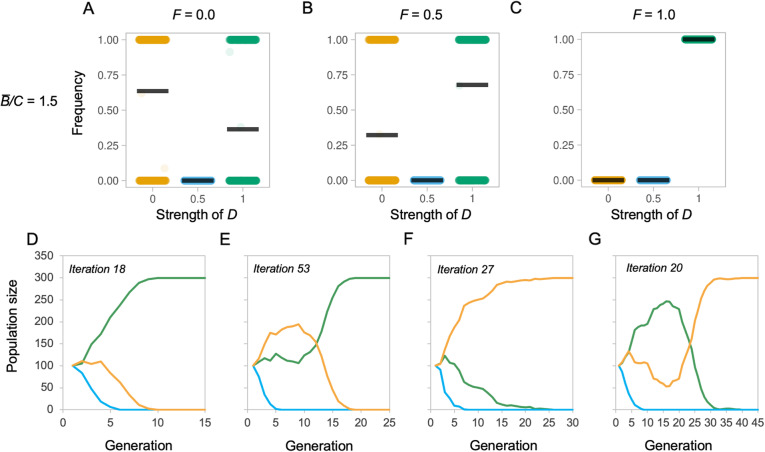
Fig. 2.
Selected examples of competition between evolving populations with different D values. a–c Each plot depicts the frequency of that D value relative to the total population (y-axis) as a function of developmental coupling D (x-axis) at the end of a 100-generation simulation run, compiled over 1000 simulation runs, under alternative environments defined by their functional coupling F, with an average benefit to cost ratio (B̅/C) of 1.5 and a mutation step size of 5%. Populations are initialised such that there are 100 fully mosaic individuals (D = 0.0), 100 partially mosaic individuals (D = 0.5) and 100 concerted individuals (D = 1.0). Each data point is the outcome of one simulation run and the black bar indicates the mean of these runs. d–g Selected, representative, individual simulations showing the change in population frequencies over generations for a 5% mutation size and B̅/C = 1.5. Colours indicate the D value, where yellow is D = 0, where blue is D = 0.5 and where green is D = 1. These show a general pattern of smooth progression from the starting state of equal populations to one D value winning out (d, f), with only a minority of iterations showing signs of populations ‘swapping’ the lead (e, g). This consistency is expected under constant selection regimes. See Additional file 1: Figure S6-S8 for full results varying B̅/C and F, iteration numbers and mutation step size, and Additional file 1: Figure S9–11 for simulations in tailored environments that illustrate parameter effects

