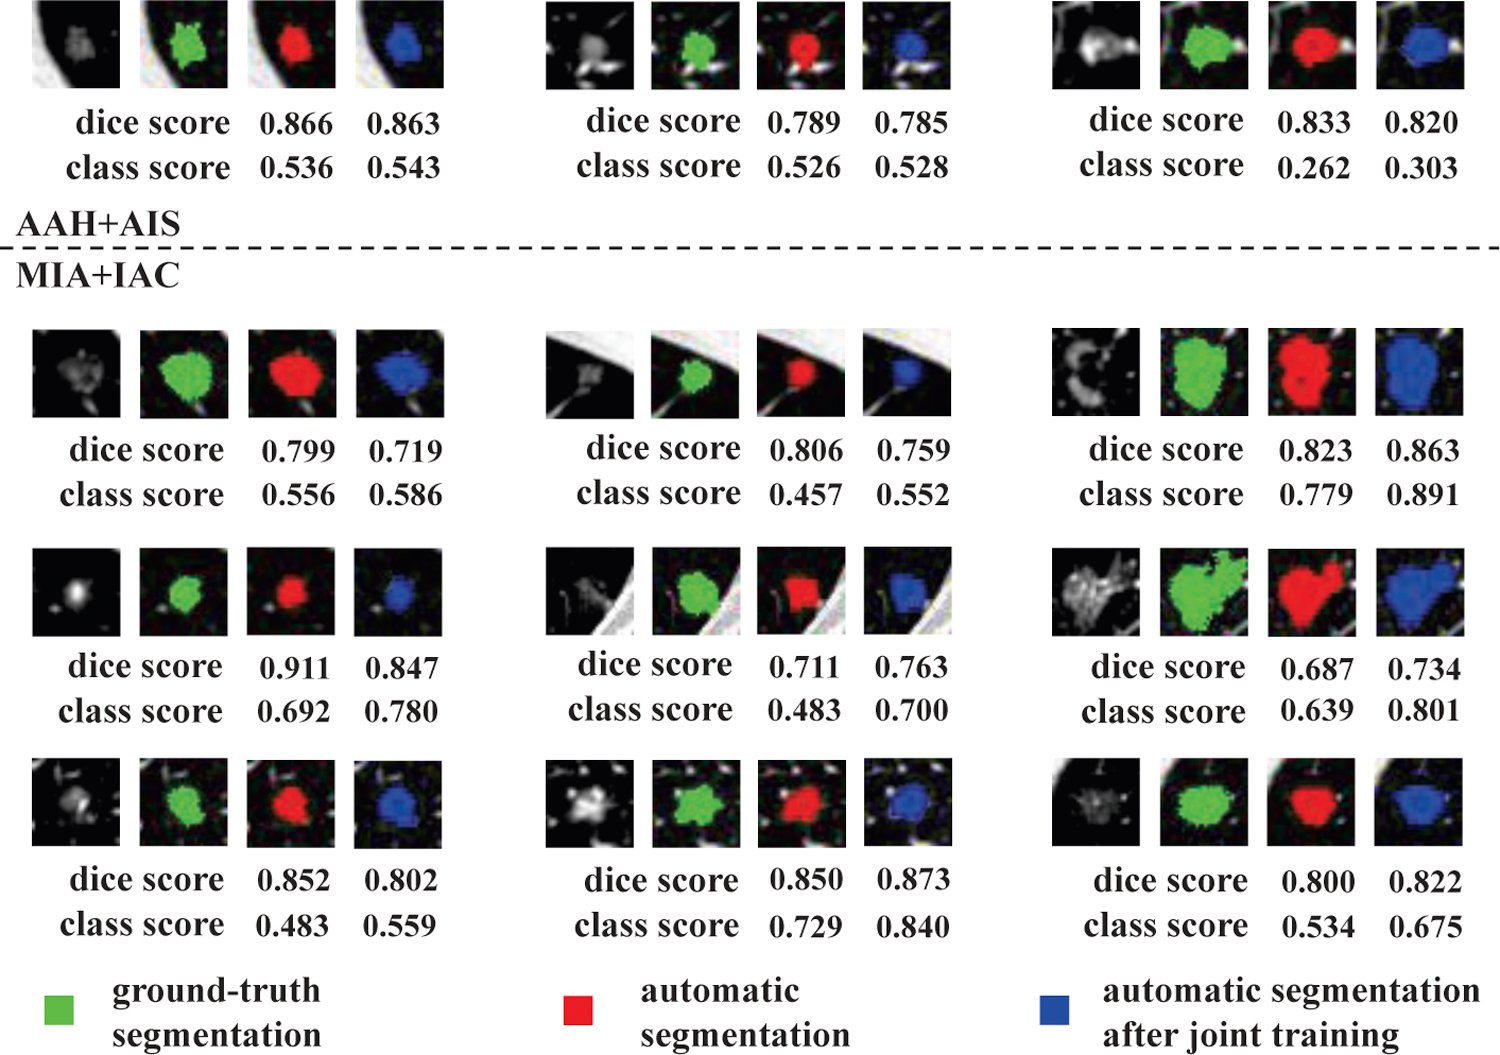
Figure 6:

Relationship between the segmentation and classification results of joint training (Take task ‘AAH+AIS, MIA+IAC’ as an example). For each case, the first image is the original data. The green mask is the ground-truth segmentation. The red mask and blue mask are the automatic segmentation map generated by the U-Net before joint training and after joint training, respectively. The Dice score and confidence score of classification of each case are also given.
