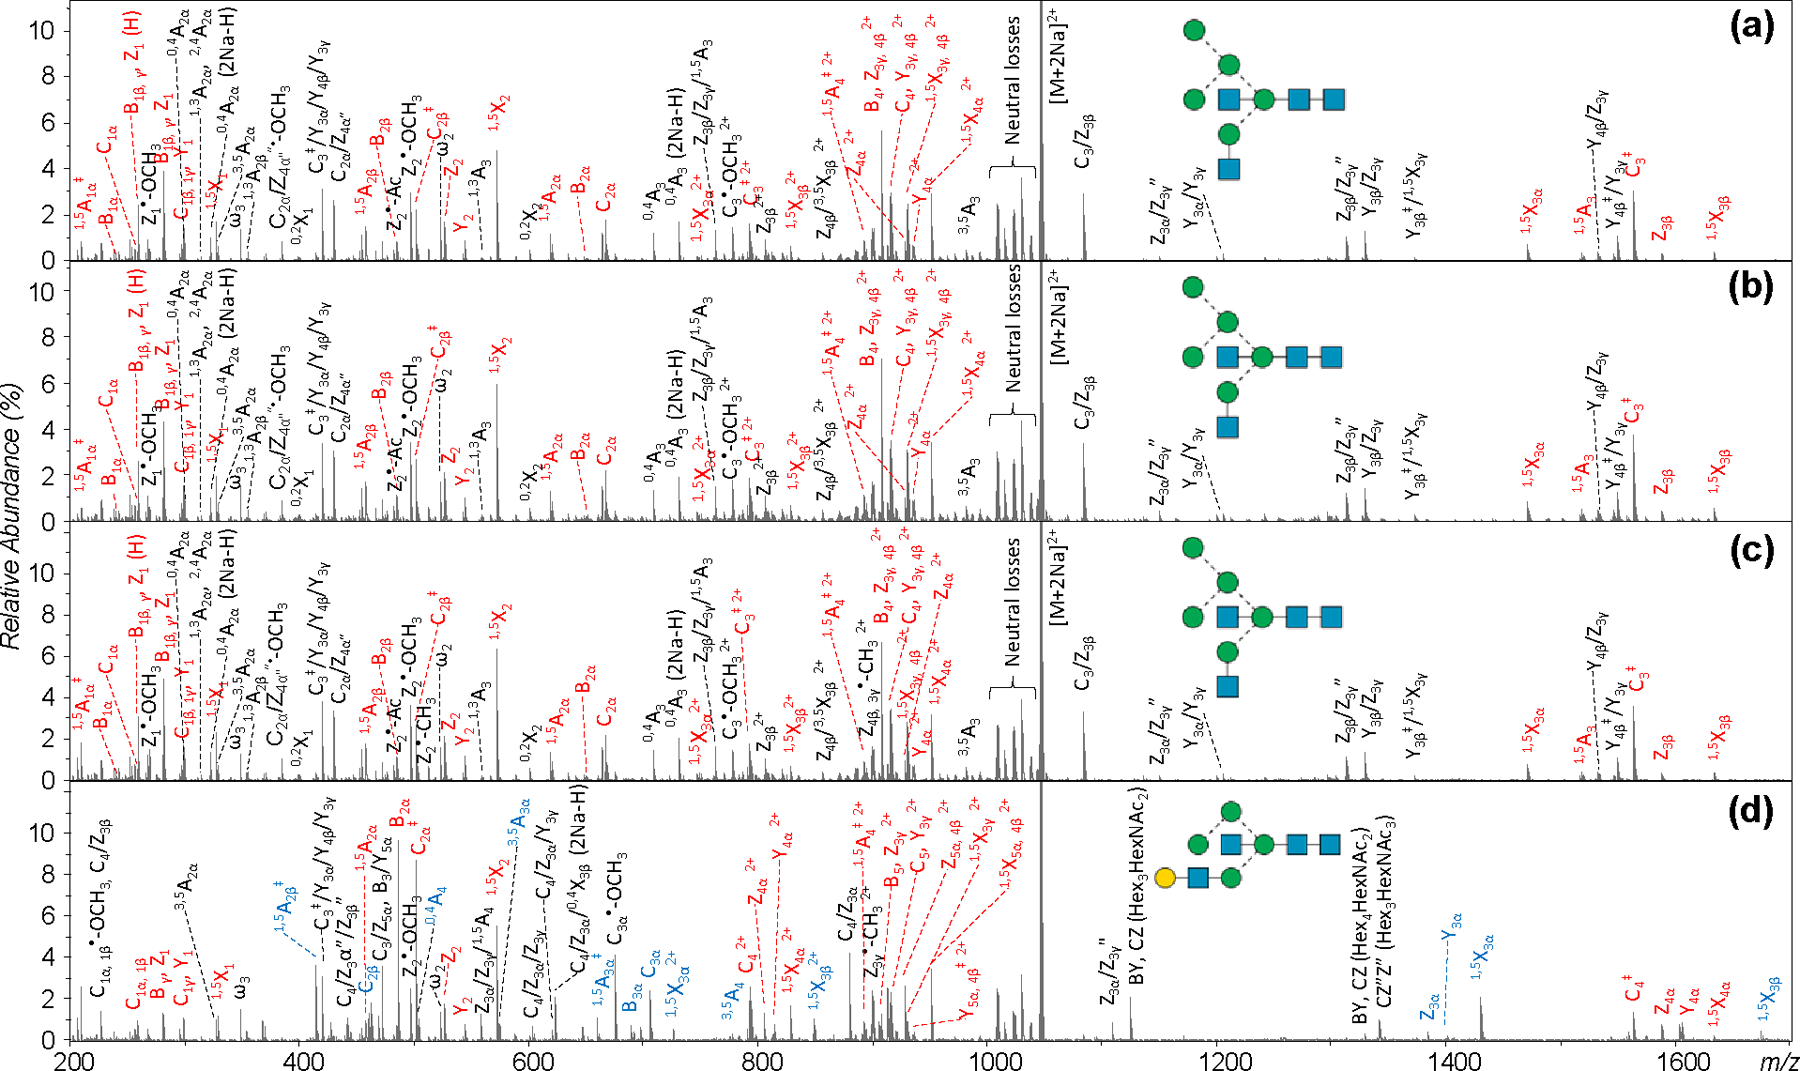
Figure 6.

(a-c) EED spectra of H5N4 ([M+2Na]2+, m/z 1046.512) from chicken ovalbumin Batch 1, acquired at the positions marked as 1, 2, and 3 in Figure 5a, respectively. (d) The EED spectrum of H5N4 from chicken ovalbumin Batch 2, acquired at position 4 in Figure 5c. Fragments discussed in the text are labeled in color.
