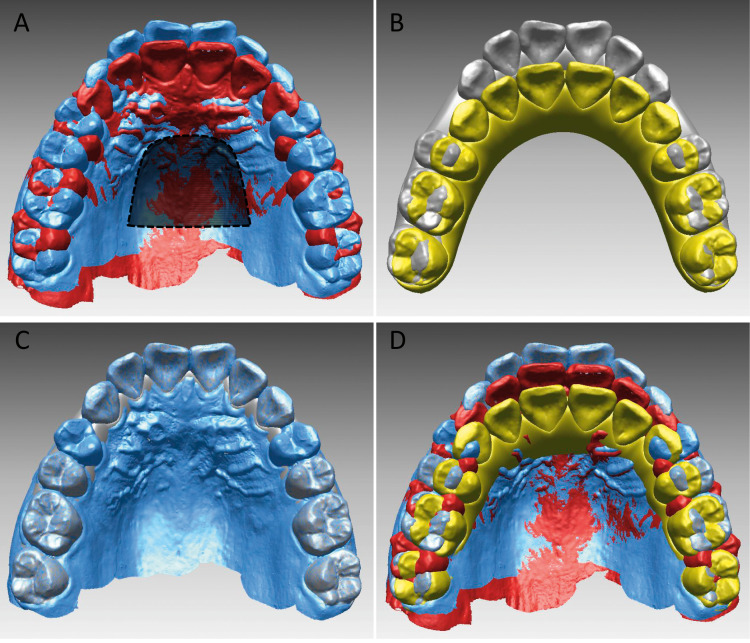
Figure 2.
Superimposition of pre- and posttreatment models. (A) Registration of actual pre- (blue) and posttreatment (red) models on the palatal stable region (dotted line). (B) Virtual pre- (gray) and posttreatment (yellow) models from ClinCheck. (C) Registration of actual and virtual pretreatment models on the dental arch. (D) Final superimposition of all four models.

