
Figure 7.
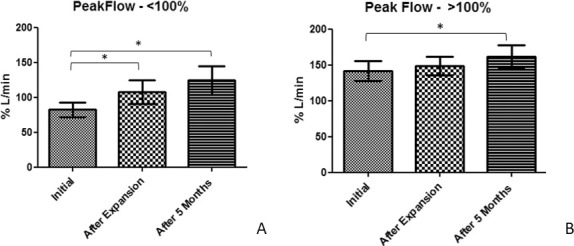
Representative mean values and standard deviation for (A) Patients with initial low oral expiratory peak flow; (B) Patients with initial good oral expiratory peak flow (*P < .05).
Official websites use .gov
A
.gov website belongs to an official
government organization in the United States.
Secure .gov websites use HTTPS
A lock (
) or https:// means you've safely
connected to the .gov website. Share sensitive
information only on official, secure websites.
Representative mean values and standard deviation for (A) Patients with initial low oral expiratory peak flow; (B) Patients with initial good oral expiratory peak flow (*P < .05).