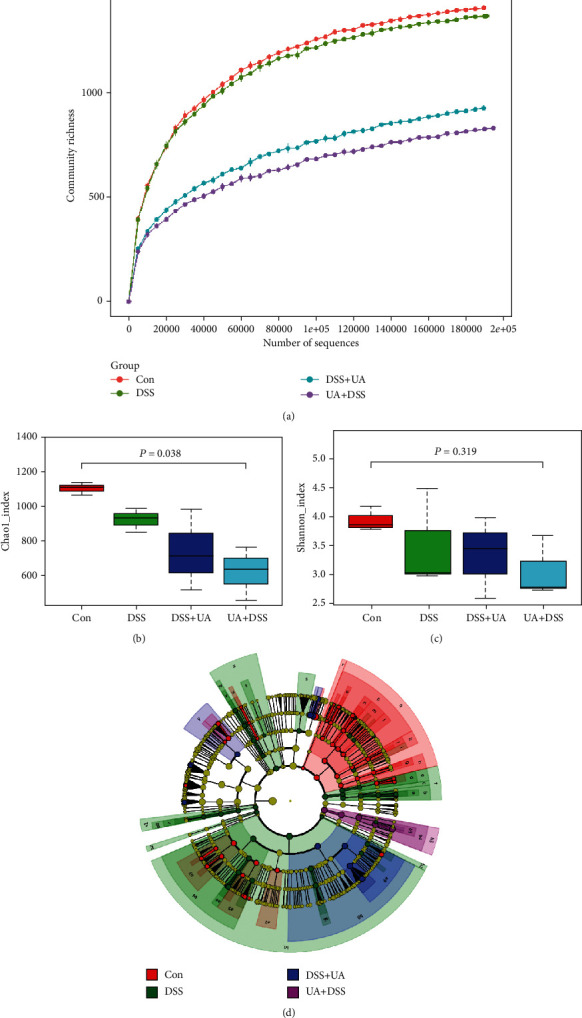
Figure 6.

Analysis of the differential microbial community among the group. (a) Rarefaction curve of microbial community richness of Con, DSS, UA + DSS, and DSS + UA groups. (b) Alpha diversity index (Chao1_index) of intestinal within groups. (c) Alpha diversity index (Shannon_index) of intestinal within groups. (d) Cladogram of the LDA value from the Con, DSS, UA + DSS, and DSS + UA groups. The Kruskal-Wallis H test was used to analyze the significant differences between groups by R.
