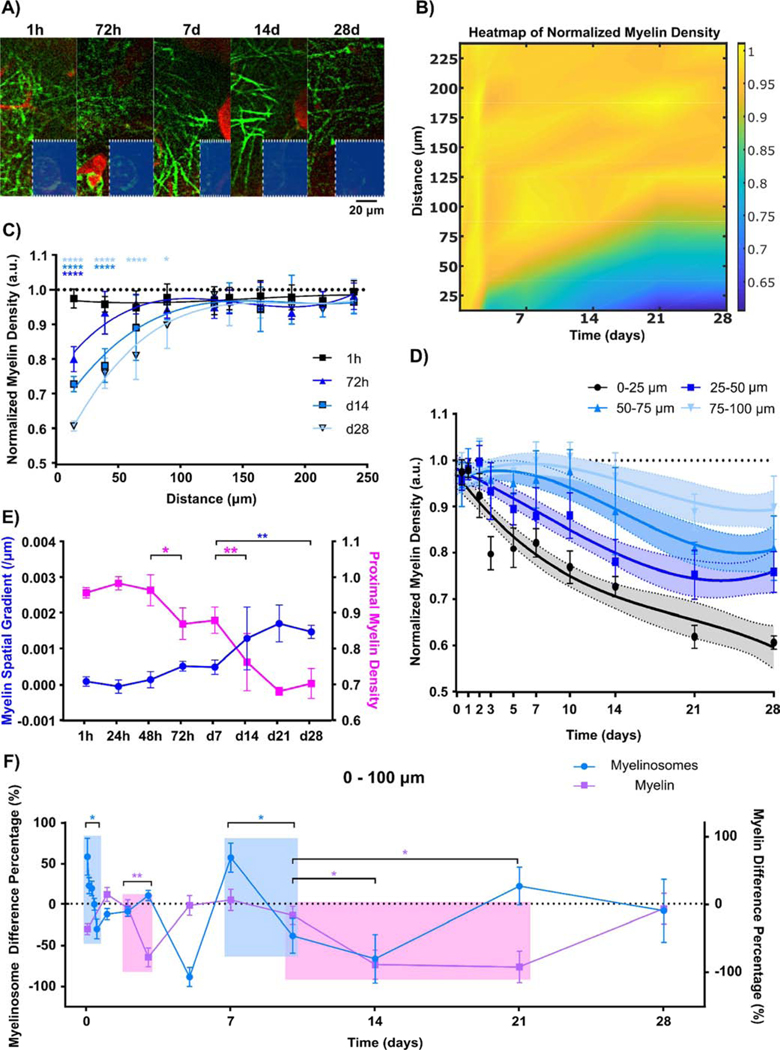
Figure 5.
Severe demyelination occurs proximal to the implant over the chronic 4-week implantation. (A) Representative time-series (1 hr to 28 days) images show a decrease in myelin distribution (green) near the implant. Red denotes SR101-labeled blood vessels. (B) Spatiotemporal heatmap of normalized myelin density over time. Visible decrease in myelin density is observed near the implant. (C) Normalized myelin density per length measurement shows significant myelin reduction occurs close to the electrode-tissue interface initially, but expands over time up to 100 μm away from the implant surface. (D) Characterization of myelin density modeled with non-linear third order polynomial (cubic) fitting (95% confidence intervals as shadowed regions). The likelihood ratio test for group-wise significance exhibits distinct spatial profiles of normalized myelin density. (E) Linear regression model of normalized myelin density over distance (spatial gradient represents regression slope and proximal density indicates regression intercept) indicates spatial patterns of normalized myelin density at the tissue-electrode interface significantly changes at 72 hr and 14 d following electrode insertion. (F) Temporal relationship of normalized myelinosome density and normalized myelin density within 100 μm of the probe demonstrates large decreases in normalized myelinosome density (light blue shadow; significant shift from positive to negative value) is followed by a delayed reduction in normalized myelin density (light pink shadow; significant negative value). Difference in percentage is determined as the difference between two time points over the average value of two time points. Positive difference percentage indicates increase compared to the previous time point, while negative difference percentage shows decline from the previous time point. (*: p < 0.05; **: p < 0.01; ***: p < 0.0005; ****: p < 0.0001) All data except (E) are presented as mean ± standard deviation. Difference percentage is reported as mean ± standard error for clear visualization.

