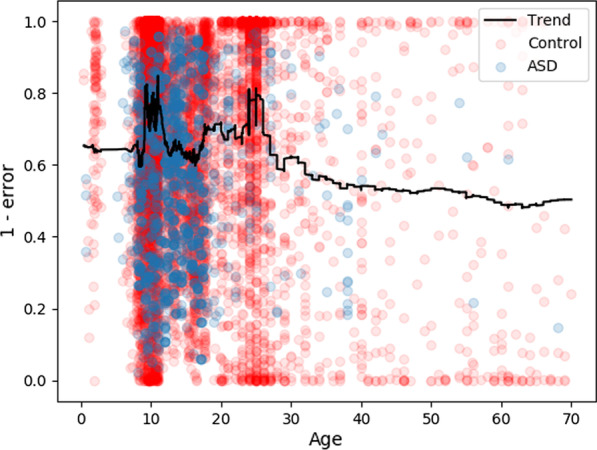
Fig. 3.

Relative classification error in the structure/function/age ensemble model, plotted against age. Each point in the graph represents the averaged classification error of the datapoint across each model in which it was included in the test set. Thus, more controls are represented which were each used individually in fewer models, while the autism datasets are fewer but were generally used in more models. This represents that accuracy was generally higher in the developmental age groups, likely because more data was present for those groups
