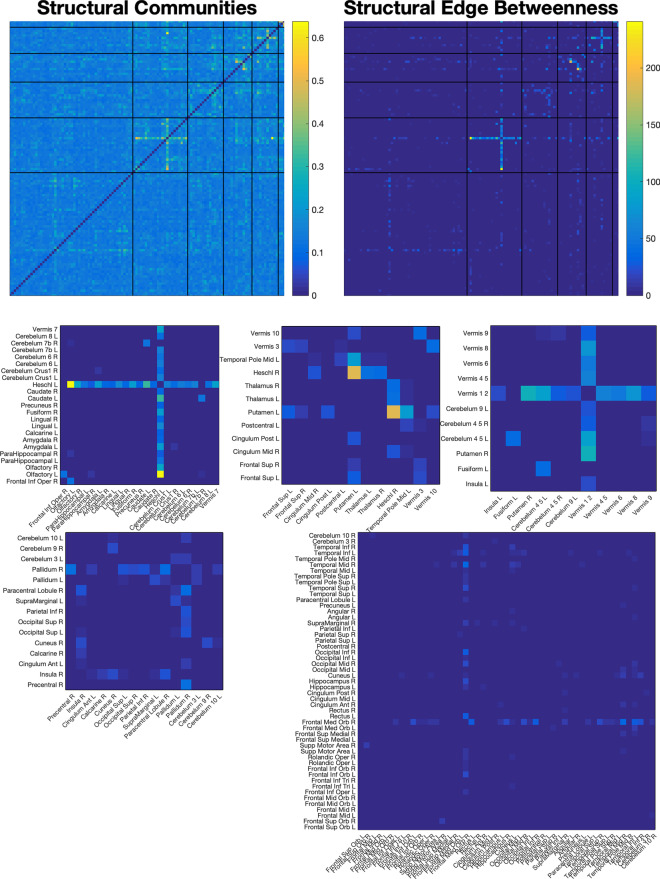
Fig. 5.
Structural hubs targeted by the structure/function/age encoding. Shown here are the class activation maps (upper left) as well as the edge betweenness centralities of the map (upper right), after it has been sorted into six different hubs via modularity maximization. The hubs, with labelled areas, are shown in the bottom half. (Middle) The three most distinct hubs revolve around the left Heschl’s gyrus; the right Heschl’s gyrus (and, to an extent, the left Putamen); and the upper vermis. The largest hub, in the bottom left, shows scattered-but-weak emphasis on connections to the right frontal medial orbital gyrus. These connections likely reflect the machine learning model’s use of comparisons of certain areas to others in order to assess the developmental difference of such areas in autism

