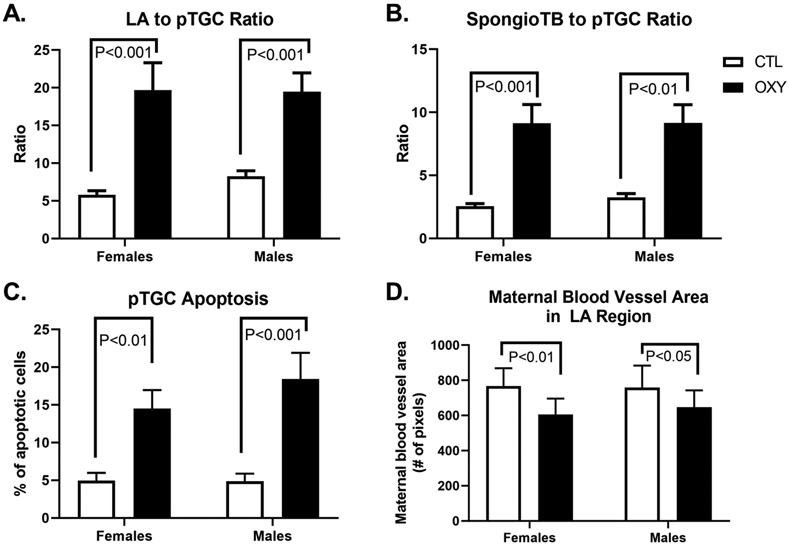
Fig. 2.

Quantification of placental histological changes. A) Labyrinth (LA) to parietal trophoblast giant cell (pTGC) area. B) Spongiotrophoblast (SpongioTB) to pTGC area. C) Number of apoptotic pTGC. D) Maternal blood vessel area in LA region. P value differences are designed in each of the graphs. For the CTL group, 10 females and 10 males were tested, and for the OXY group, 11 females and 11 males were tested.
