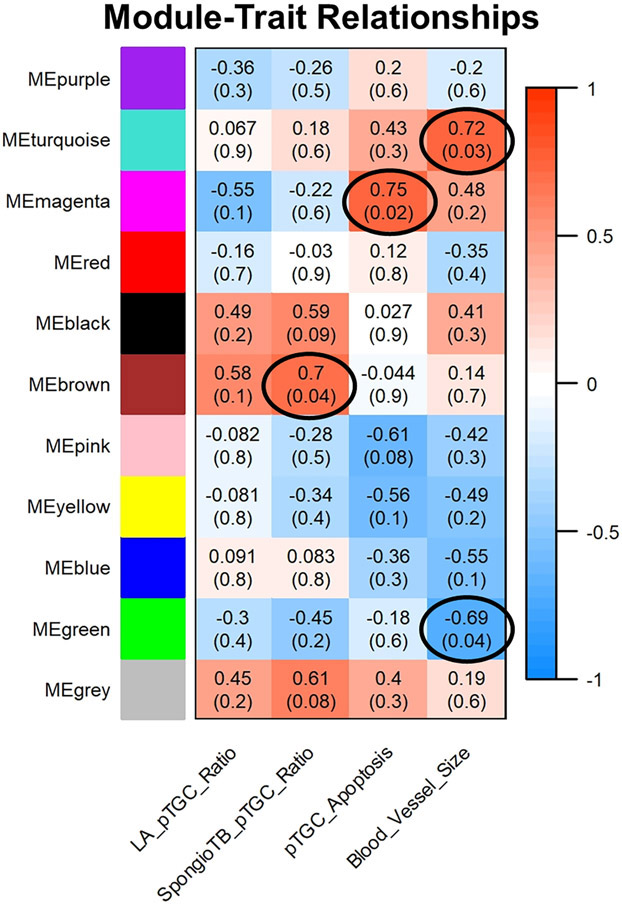
Fig. 8.
Relationship of WGCNA results and placental morphometric assessments for OXY female vs. CTL female comparison. Modules identified in Supplementary Fig. 5 were correlated with placental morphometric assessments (Fig. 2). Each row corresponds to a Module Eigengene (ME) and colors represent the correlation coefficient between the ME and one of the four placental histological measurements (LA to pTGC ratio; SpongioTB to pTGC ratio; pTGC apoptosis; Maternal blood vessel area in LA region). Numbers at the top of rows represents degree of correlation, and values with a negative integer indicate an inverse correlation with one of the four placental measurements. ME Brown was positively associated with SpongioTB to pTGC ratio (r = 0.7; p = 0.04). ME Magenta was positively associated with pTGC apoptosis (r = 0.75; p = 0.02). ME turquoise was positively associated with maternal blood vessel area (r= 0.72; p = 0.03); whereas, ME Green was negatively correlated with this category (r = −0.69; p = 0.04). A legend that ranges from blue to red shades (−1 to 1, respectively) is included to the right of the Figure. Genes within these four modules are listed in Supplementary File 6. This analysis is based on the results from 10 OXY females and 9 CTL females.

