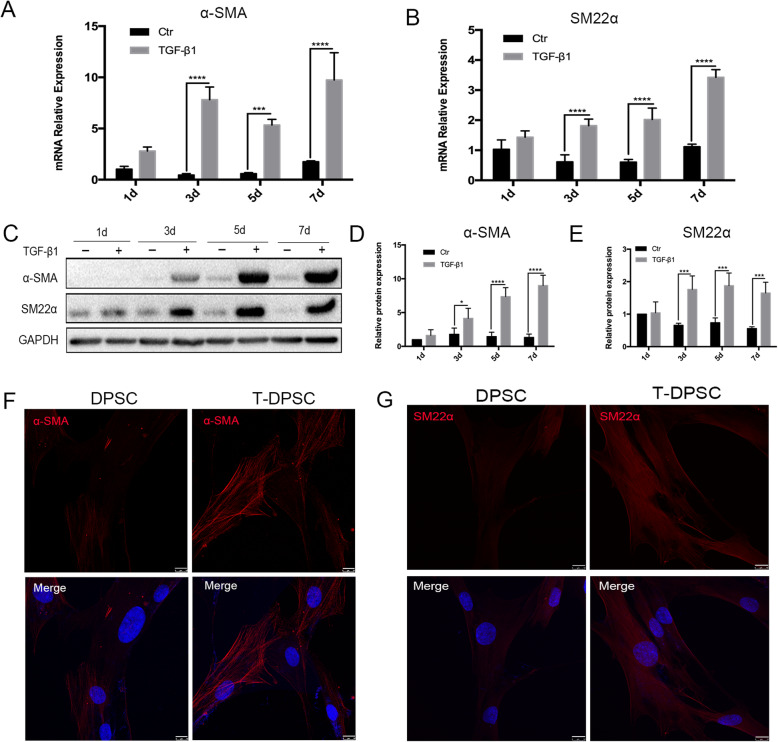
Fig. 2.
TGF-β1 induced the expression of α-SMA and SM22α in DPSCs. a, b RT-qPCR analysis of the relative mRNA expression of α-SMA and SM22α in DPSCs after treatment with TGF-β1 (10 ng/mL) for 1, 3, 5, and 7 days. c–e Western blot analysis of the expression of α-SMA and SM22α in DPSCs after treatment with TGF-β1 (10 ng/mL) for 1, 3, 5, and 7 days. f, g Representative immunofluorescence images of α-SMA (red) and SM22α (red) in DPSCs treated with TGF-β1 for 7 days. Scale bar represents 10 μm. Data are mean ± standard error for n = 3 replicates, *p < 0.05, ***p <0.001, ****p <0.0001

