
Figure 9.B.
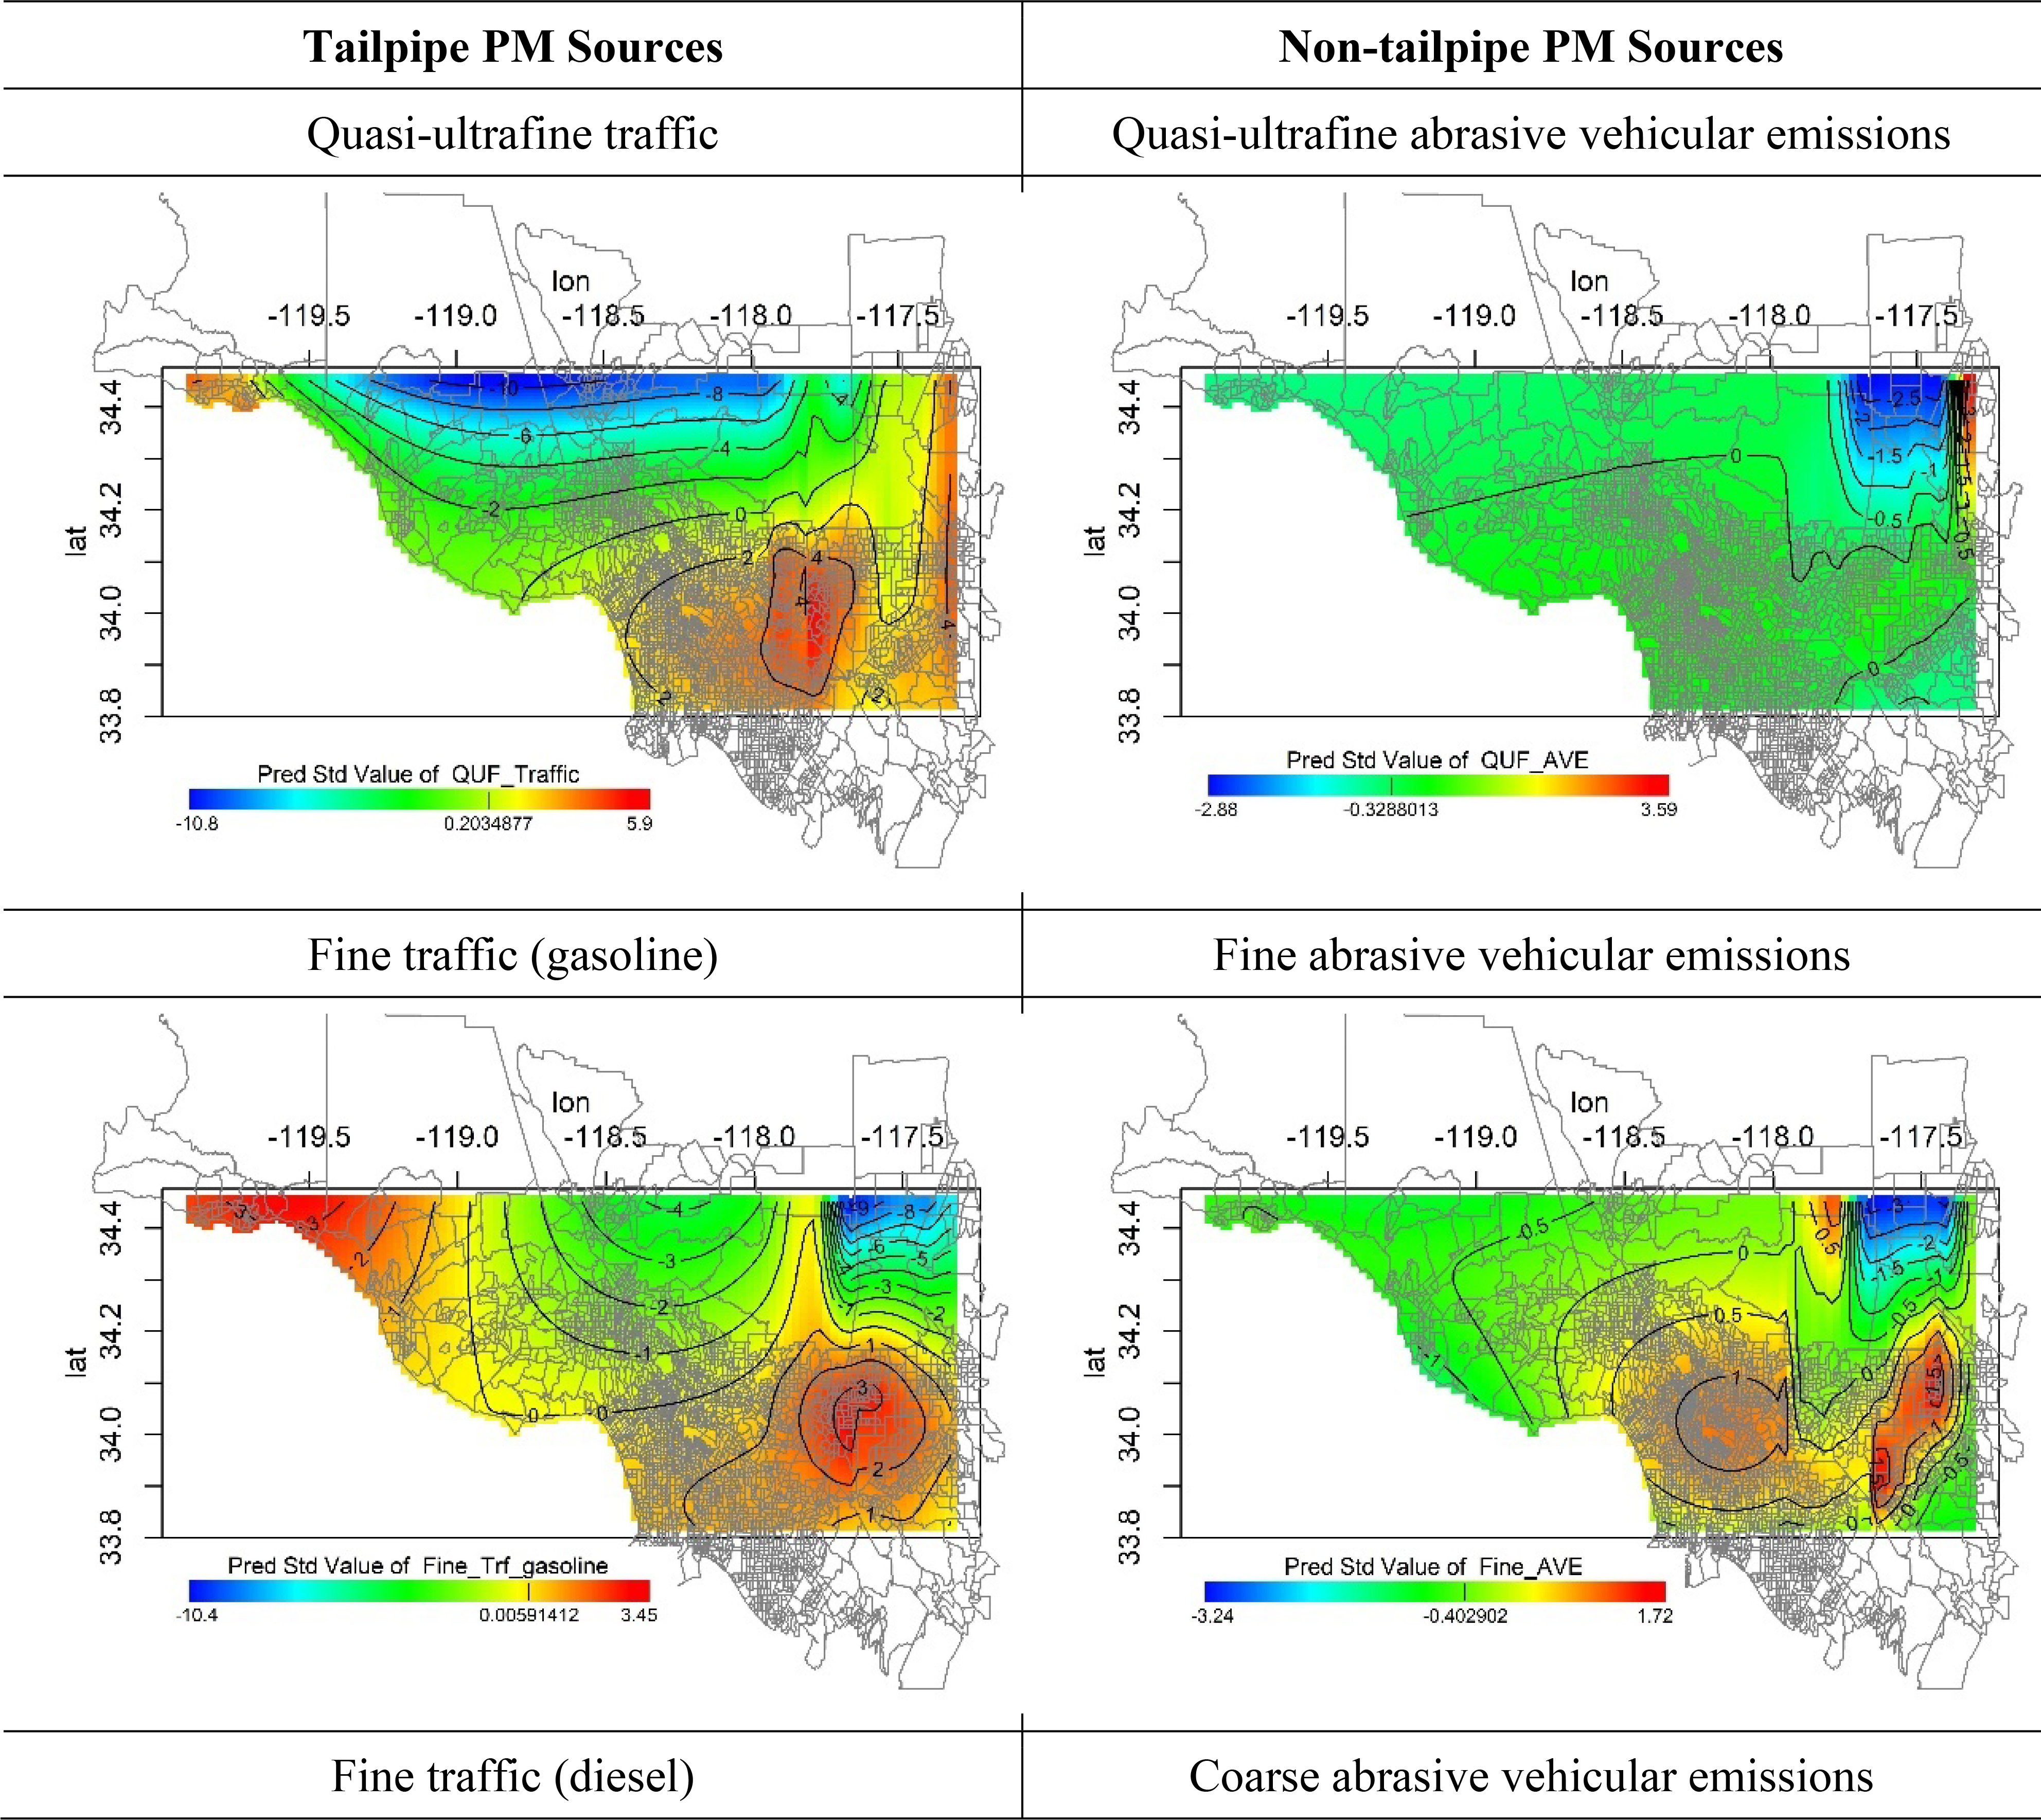
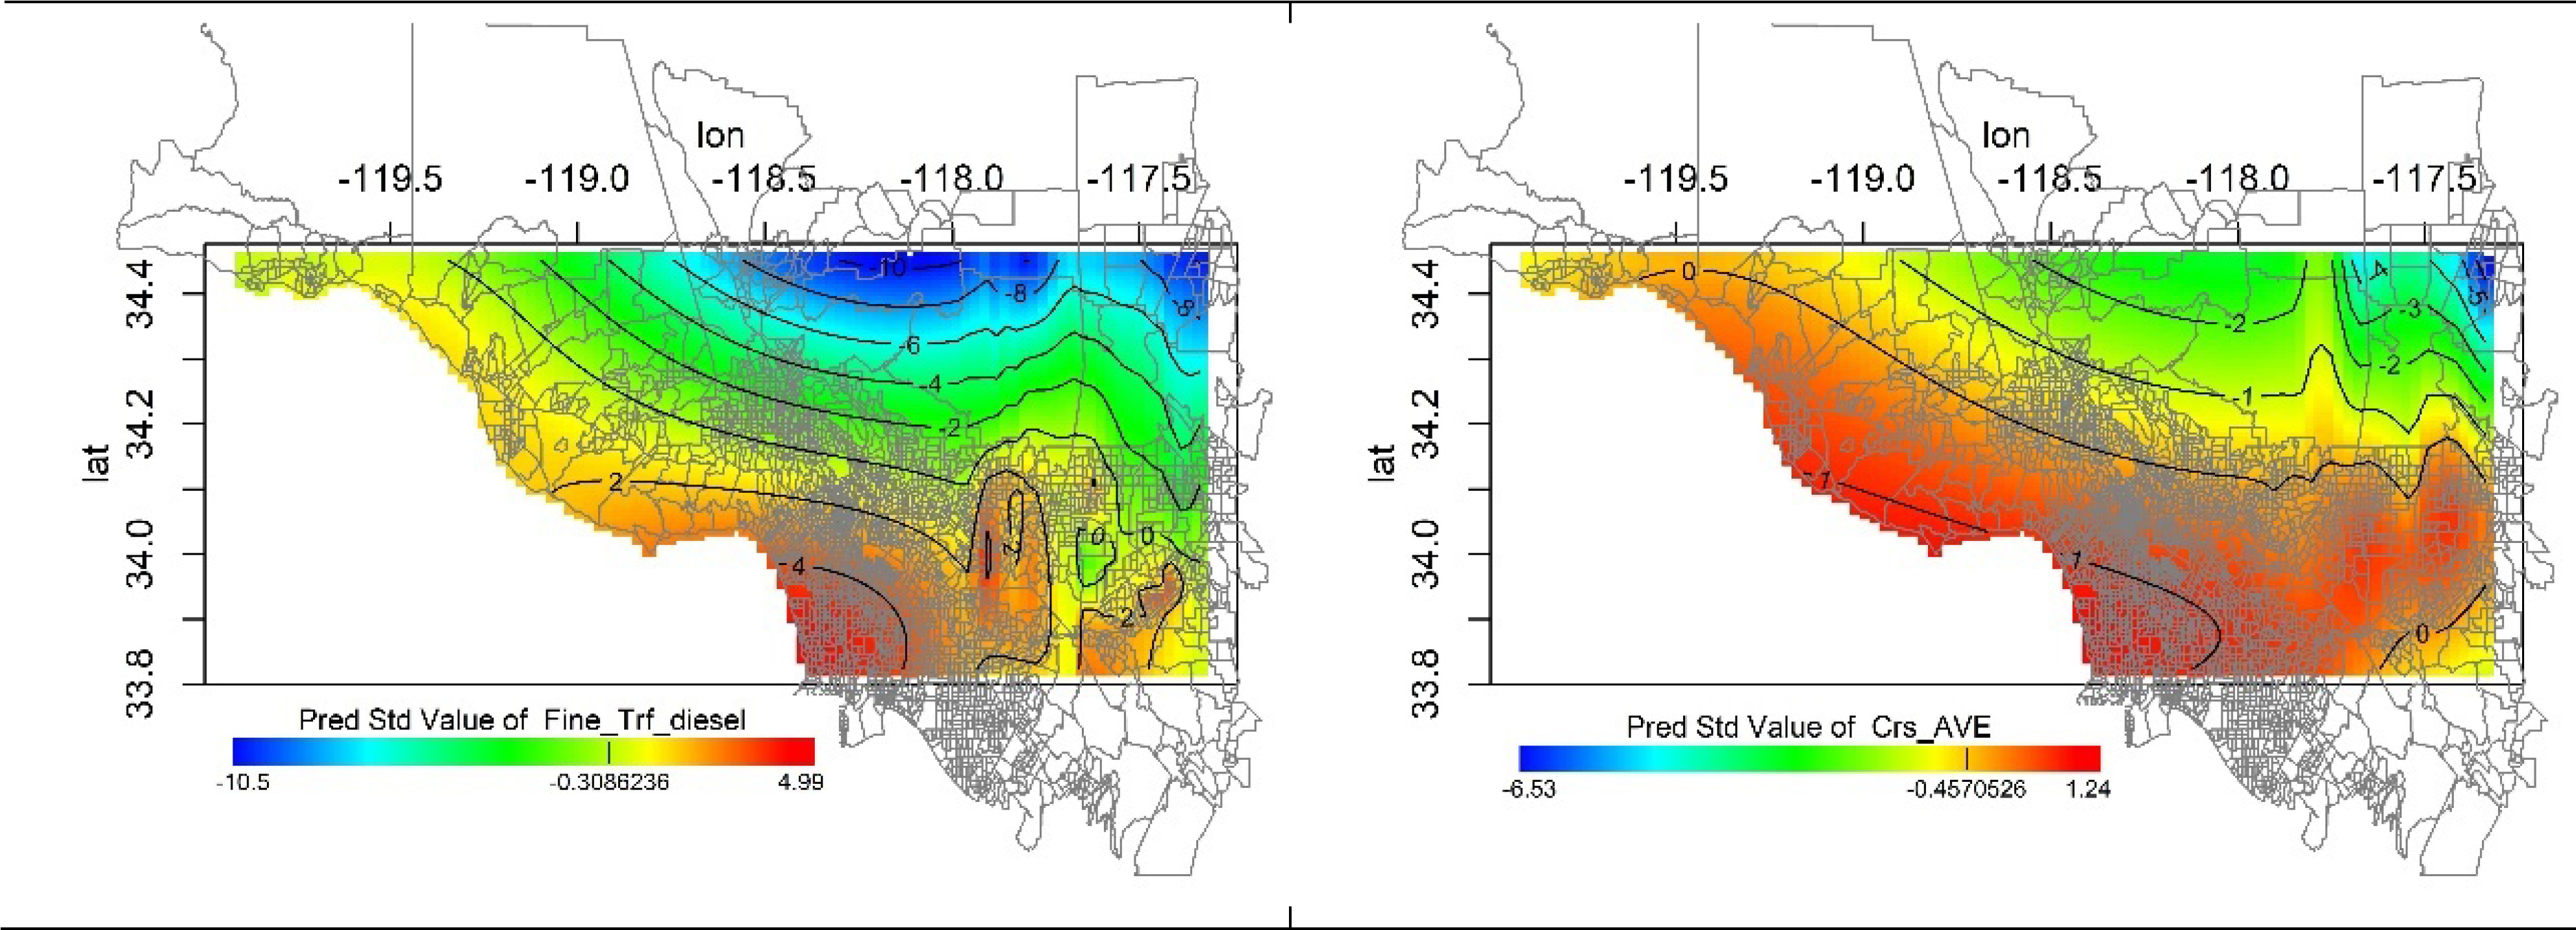
Predicted surfaces of traffic-related sources from GAM models on standardized scale, excluding Long Beach from the analysis. Contour lines delineate areas (locations) of statistically significant higher (red) or lower (blue) concentrations. Vertical lines in color scale indicate median values.