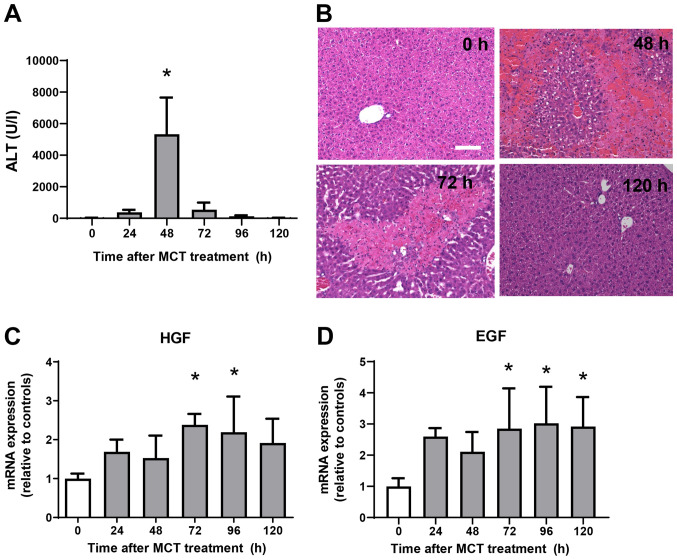
Figure 1.
Liver injury after monocrotaline (MCT) treatment. (A) Time-dependent changes in ALT levels during MCT hepatotoxicity (n=7-8 mice per group). (B) Typical histological appearance of hematoxylin and eosin-stained liver sections were analyzed at 0, 48, 72 and 120 h post-MCT treatment (scale bars, 100 µm). Expression of (C) HGF and (D) EGF mRNA in the livers of mice treated with MCT. Data are presented as the mean ± SD (n=5-6 mice per group). *P<0.05 vs. 0 h. MCT, monocrotaline; ALT, alanine transaminase; HGF, hepatocyte growth factor; EGF, epidermal growth factor.

