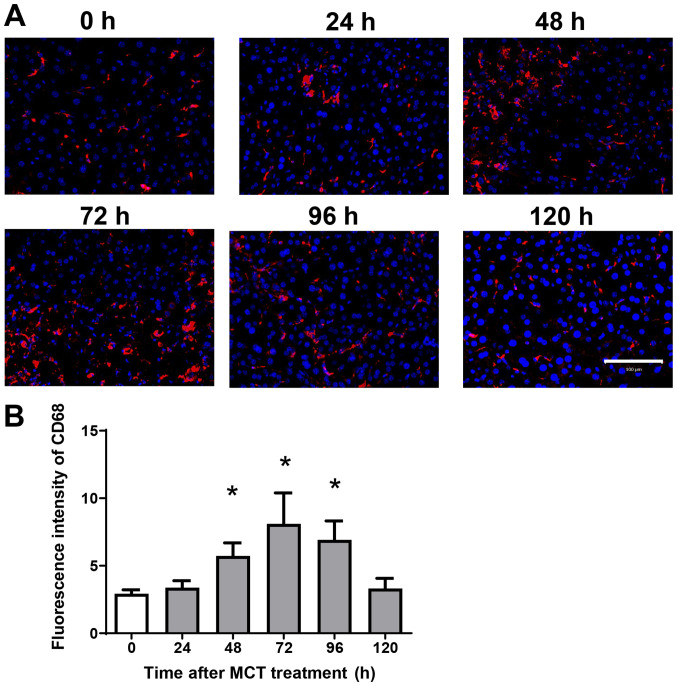
Figure 2.
Accumulation of macrophages during MCT hepatotoxicity. (A) Immunofluorescence analysis of the macrophage marker CD68 (red) in the livers of mice treated with MCT. Nuclei are stained with DAPI (blue). Scale bars represent 100 µm. (B) Fluorescence intensity of CD68 in the livers of mice treated with MCT. Data are expressed as the mean ± SD (n=4 mice per group). *P<0.05 vs. 0 h. MCT, monocrotaline.

