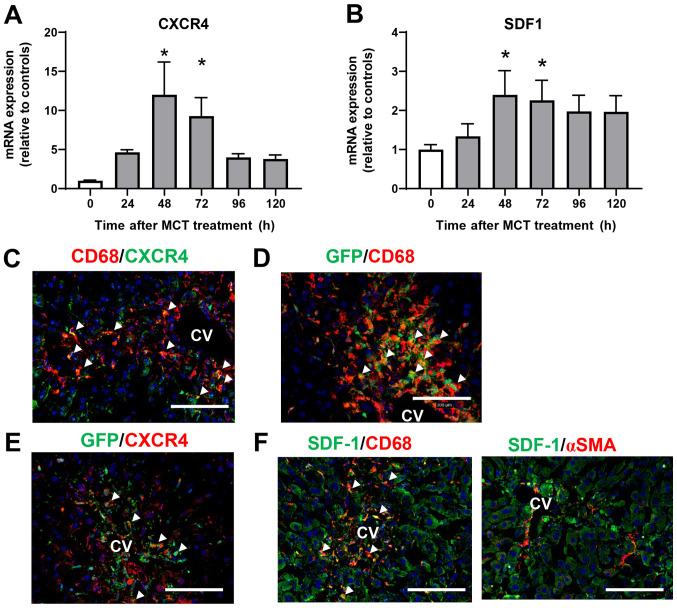
Figure 4.
Macrophages expressing CXCR4 accumulate in the liver during the repair phase of MCT hepatotoxicity. Expression of mRNA encoding (A) SDF-1 and (B) CXCR4 in the livers of mice treated with MCT. Data are expressed as the mean ± SD (n=4-6 mice per group). *P<0.05 vs. 0 h. Representative double immunofluorescence images showing (C) CD68 (red) and CXCR4 (green) or (D) GFP (green) in the livers of mice at 72 h post-MCT treatment. White triangles indicate merged cells. Scale bars represent 100 µm. (E) Representative double immunofluorescence images of CXCR4 (red) and GFP (green) in the livers of mice at 72 h post-MCT treatment. White triangles indicate merged cells. Scale bars represent 100 µm. (F) Representative double immunofluorescence images of SDF-1 (green) and CD68 (red) or αSMA (red) in the livers of mice at 72 h post- MCT treatment. CV, central vein. White triangles indicate merged cells. Scale bars, 100 µm. CXCR4, C-X-C chemokine receptor type 4; MCT, monocrotaline; SDF-1, stromal cell-derived factor-1; GFP, green fluorescent protein; αSMA, α smooth muscle actin; CV, central vein.

