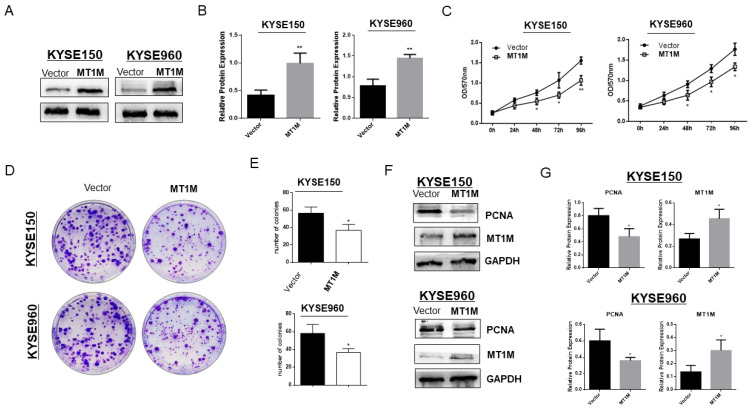
Fig. 3. Ectopic expression of MT1M suppressed ESCC cell growth.
(A) Western blot confirmed the stable re-expression of MT1M in MT1M-transfected KYSE150 and KYSE960 cell lines. (B) Quantitative analysis of western blots. Asterisks indicate a significant level of proliferation compared with controls (**P < 0.01). (C) MTS assay for cell proliferation on vector- and MT1M-transfected stable cell lines. Asterisks indicate a significant level of proliferation compared with controls (*P < 0.05, **P < 0.01). (D) Ectopic expression of MT1M inhibited colony formation in KYSE150 and KYSE960 cell lines. (E) Quantitative analysis of colony formation. Values are expressed as the mean ± SD from three independent experiments, and the asterisk indicates the statistical significance compared to the controls (*P < 0.05). (F) Western blot indicated proliferation marker PCNA expression was inhibited by MT1M expression. (G) Quantitative analysis of western blots.

