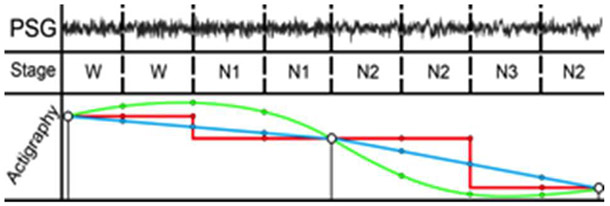
Figure 3.
Smoothed (green), nearest-neighbor interpolation (red), and linear interpolation (blue) compared with interpolated actigraphy and PSG data. Note that due to the sampling frequency disparity with PSG (2 Hz), actigraphy data (0.5 Hz) was interpolated to match the physician-validated sleep scoring.

