Figure 6.
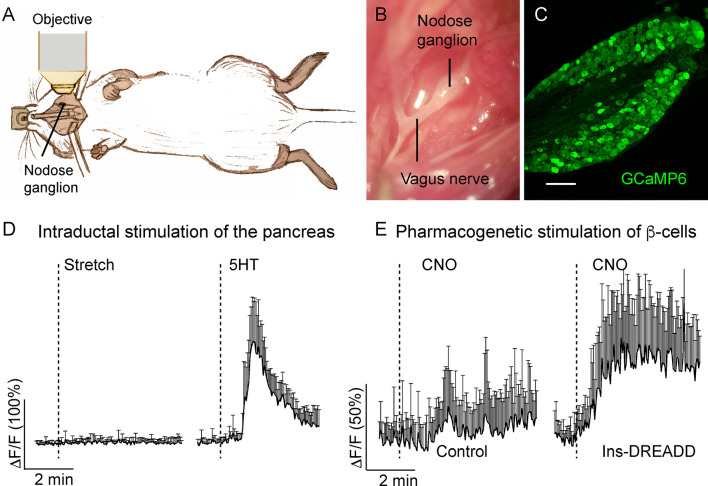
In vivo imaging of the mouse nodose ganglion (figure adapted and modified from Figures 3, 4 in Makhmutova et al, 2020). (A) Drawing illustrates the experimental set up, where the intact nodose ganglion is exposed for Ca2+ imaging under a confocal microscope. (B) Photomicrograph of the exposed nodose ganglion. (C) Section of the nodose ganglion from a Pirt-GCaMP6 mouse. (D) Average traces of fluorescence intensity changes over baseline (δF/F) in nodose ganglion neurons, demonstrating neuronal responses to stretch (intraductal pancreatic infusion with saline, 300 µl/min) or intraductal application of 5-HT (1 mM, 150 µl/min). (E) Average traces of fluorescence intensity changes over baseline (δF/F) in nodose ganglion neurons, demonstrating neuronal responses to pharmacogenetic stimulation of β-cells by i.p. injection of clozapine nitric oxide (CNO, 5 mg/kg) in control mice or in mice expressing designer receptor activated by designer drug (DREADD) exclusively in β-cells. Shown is the mean trace of 10 neurons (+/- SEM).

