
Figure 2.
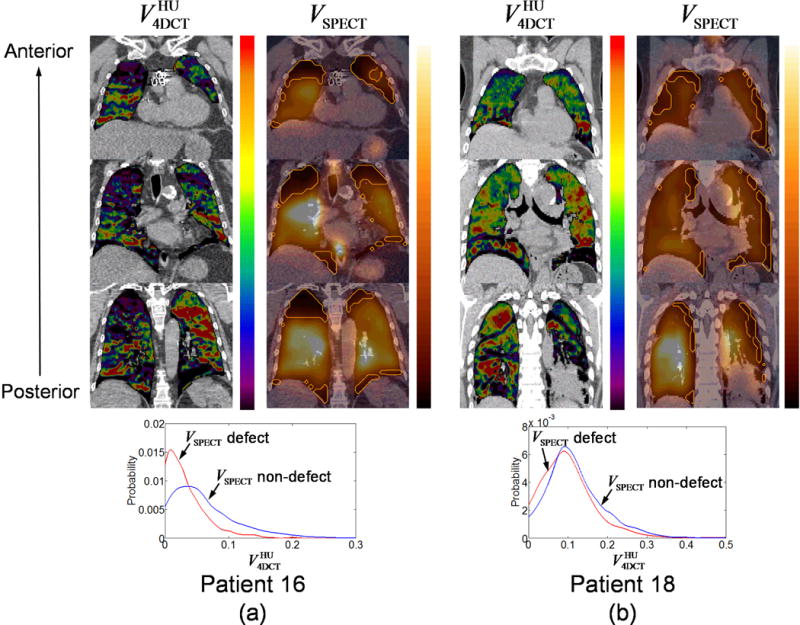
Comparison of and VSPECT for (a) patient 16, showing a large separation between the probability density functions of in VSPECT defect regions and non-defect regions, and (b) patient 18, showing a small separation. Orange outlines in VSPECT denote defect regions. Both and VSPECT are shown with a scale from zero to the 90th percentile value.