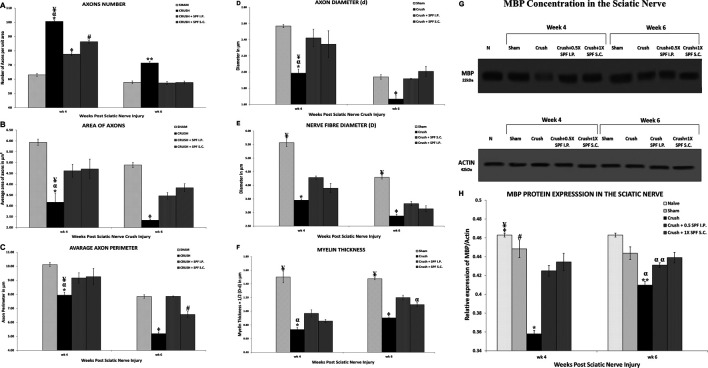
FIGURE 5.
(A): Number of axons/field (at ×1,000 magnification) in a cross-section of the sciatic nerve distal to the injury site. Note SPN treatments significantly decreased the number of axons/field following nerve crush injury at Week 4. Further, the number of axons/field of the SPF-FB-treated groups returned to the SHAM level by Week 6. * indicates p < 0.0001 CRUSH vs. SHAM; α indicates p < 0.001 CRUSH vs. CRUSH + 0.5X SPF-FB(IP); ¥ indicates p < 0.01 CRUSH vs. CRUSH + 1X SPF-FB(S.C.); Φ indicates p < 0.02 CRUSH + 0.5X SPF-FB (IP) vs. SHAM; # indicates p < 0.001 CRUSH + 1X SPF-FB(S.C.) vs. SHAM; ** indicates p < 0.005 CRUSH vs. all groups. (B): The Crush + SPF-FB animals showed a significant increase in the mean cross-sectional areas of the myelinated axons at Week 4 and Week 6 compared with the Crush group. * indicates p < 0.002 CRUSH vs. SHAM; α indicates p < 0.01 CRUSH vs. CRUSH + 0.5X SPF-FB (IP); ¥ indicates p < 0.05 CRUSH vs. CRUSH + 1X SPF-FB(S.C.); Φ indicates p < 0.01 CRUSH vs. all groups. (C): The CRUSH + SPF-FB-treated animals showed a significant increase in the mean cross-sectional areas of the myelinated axons at Week 4 and Week 6 compared to the CRUSH group. * indicates p < 0.002 CRUSH vs. SHAM; α indicates p < 0.02 CRUSH vs. CRUSH + 0.5X SPF-FB(IP); ¥ indicates p < 0.03 CRUSH vs. CRUSH + 1X SPF-FB(S.C.); Φ indicates p < 0.0001 CRUSH vs. all groups; # indicates p < 0.003 CRUSH + 1X SPF-FB(S.C.) vs. CRUSH + 0.5X SPF-FB(IP). (D–F): Stereological estimation of the myelinated axon diameter (D), myelinated nerve fiber diameter (E), and myelin thickness (F) obtained from 10 different random samples from each group (n = 5). (D): The CRUSH animals displayed a significant decrease in axon diameter at all the time points assessed following nerve injury compared with SHAM and CRUSH + SPF-FB-treated groups. The CRUSH + SPF-FB-treated group showed no significant change in comparison with SHAM animals at Week 4 and Week 6. * indicates p < 0.002 CRUSH vs. SHAM; α indicates p < 0.01 CRUSH vs. CRUSH + 0.5X SPF-FB(IP); ¥ indicates p < 0.03 CRUSH vs. CRUSH + 1X SPF-FB(S.C.); Φ indicates p < 0.03 CRUSH vs. All groups. E: Likewise, the CRUSH group displayed a significant decrease in nerve fiber diameter at all the time points assessed following nerve injury compared with SHAM and CRUSH + 0.5X SPF-FB(IP) groups. * indicates p < 0.001 CRUSH vs. CRUSH + 0.5X SPF-FB(IP); ¥ indicates p < 0.0001 SHAM vs. All treated groups; Φ indicates p < 0.04 CRUSH vs. CRUSH + 0.5X SPF-FB(IP). (F): The calculated myelin thickness for the CRUSH and CRUSH + SPF-treated groups show a significant decrease in myelin thickness compared to SHAM animals at Week 4 and Week 6 following sciatic nerve injury. However, the myelin thickness in CRUSH + SPF-treated animals increased significantly at Week 4 and became more at Week 6 compared with the CRUSH group. ¥ indicates p < 0.01 SHAM vs. All groups; * indicates p < 0.003 CRUSH vs. CRUSH + 0.5X; SPF-FB(IP); α indicates p < 0.05 CRUSH and CRUSH + 1X SPF-FB(S.C.) vs. CRUSH + 0.5X SPF-FB(IP); Φ indicates p < 0.007 CRUSH vs. CRUSH + 0.5X SPF-FB(IP) and CRUSH + 1X SPF-FB(S.C.). Values are expressed as means and SDs (error bars). (G): Western blot analysis of myelin basic protein (MBP) in the sciatic nerves from the experimental groups (n = 5) at Week 4 and Week 6 following nerve injury. Note thick MBP bands in the CRUSH + SPF-FB-treated group. (H): Bar graph shows the MBP density in distal nerve samples normalized with actin band densities. Note significantly increased basic myelin content in the SPF-treated group at Week 4 and Week 6 post sciatic nerve injury. * indicates p < 0.0001 CRUSH vs. All groups; Φ indicates p < 0.02 NAÏVE vs. CRUSHv0.5X SPF-FB(IP); ¥ indicates p < 0.0001 NAÏVE vs. CRUSH + 1X SPF(S.C.); # indicates p < 0.02 SHAM vs. CRUSH + 0.5X SPF(IP); ** indicates p < 0.0001 CRUSH vs. NAÏVE and SHAM; α indicates p < 0.01 CRUSH vs. treated groups; α α indicates p < 0.0001 CRUSH + 0.5X SPF-FB(IP) vs. NAÏVE. All values are expressed as means + SDs (error bars).

