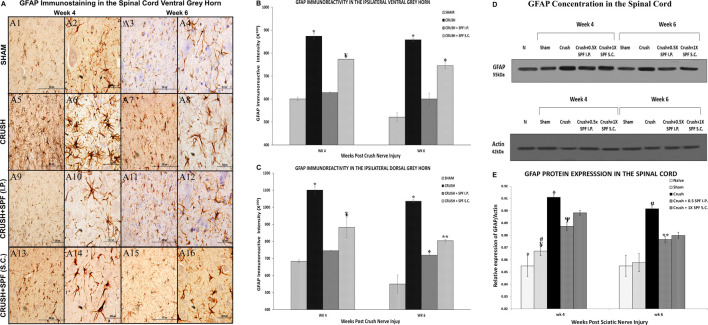
FIGURE 9.
(A): Representative 40× and 100× photomicrographs of lumbar spinal cord ventral grey horn immunostained for GFAP at Week 4 and Week 6 post-injury. Note an increasing number of GFAP-immunoreactive astrocytes in the CRUSH group compared to the SHAM and IP and S.C. SPF-FB-treated groups. (B): Bar graph shows the number of GFAP-immunoreactive astrocytes in the ipsilateral ventral grey horn at week 4 and week 6 post-injury. Note the significant increase in the number of GFAP-immunoreactive astrocytes in the CRUSH group. In contrast, the number of GFAP-immunoreactive astrocytes significantly decreased in the CRUSH + 1X SPF-FB(S.C.) and CRUSH + 0.5X SPF-FB(S.C.)-treated groups. * indicates p < 0.0001 CRUSH vs. All groups; ¥ indicates p < 0.0001 CRUSH + 1X SPF-FB(S.C.) vs. all groups; Φ indicates p < 0.002 CRUSH + 0.5X SPF-FB(S.C.) vs. CRUSH and CRUSH + SPF-FB (IP). (C): Bar graph shows the number of GFAP-immunoreactive astrocytes in the ipsilateral dorsal grey horn at week 4 and week 6 post-injury. Note the significant increase in GFAP-immunoreactive astrocytes in the CRUSH group compared to all experimental groups. Moreover, IP and S.C. SPF-FB treatments significantly decrease the number of GFAP-immunoreactive astrocytes at Week 4 and Week 6 following sciatic nerve injury. * indicates p < 0.0001 CRUSH vs. All groups; ¥ indicates p < 0.02 CRUSH + 1X SPF-FB(S.C.) vs. SHAM; Φ indicates p < 0.01 CRUSH + 0.5X SPF-FB(IP) vs. SHAM; ** indicates p < 0.001 CRUSH + 1X SPF-FB(S.C.) vs. SHAM. (D): Western blot analysis of GFAP in the lumbar spinal cords at Week 4 and Week 6 following nerve injury. (E): Bar graph shows the GFAP density in spinal cord samples. Note significantly decreased GFAP content in the CRUSH + 0.5X SPF-FB-FB (IP) spinal cords-treated groups. * indicates p < 0.0001 NAÏVE vs. All groups; ¥ indicates p < 0.0001 SHAM vs. CRUSH; # indicates p < 0.004 SHAM vs. CRUSH + 01X SPF-FB(S.C.) and CRUSH + 2X SPF-FB(S.C.); Φ indicates p < 0.002 CRUSH vs. CRUSH + SPF-FB(IP); Ψ indicates p < 0.003 SHAM vs. CRUSH + 0.5X SPF-FB(IP); α indicates p < 0.0001 CRUSH vs. NAÏVE and SHAM; ** indicates p < 0.05 CRUSH + 0.05X SPF-FB(IP) vs. CRUSH.

