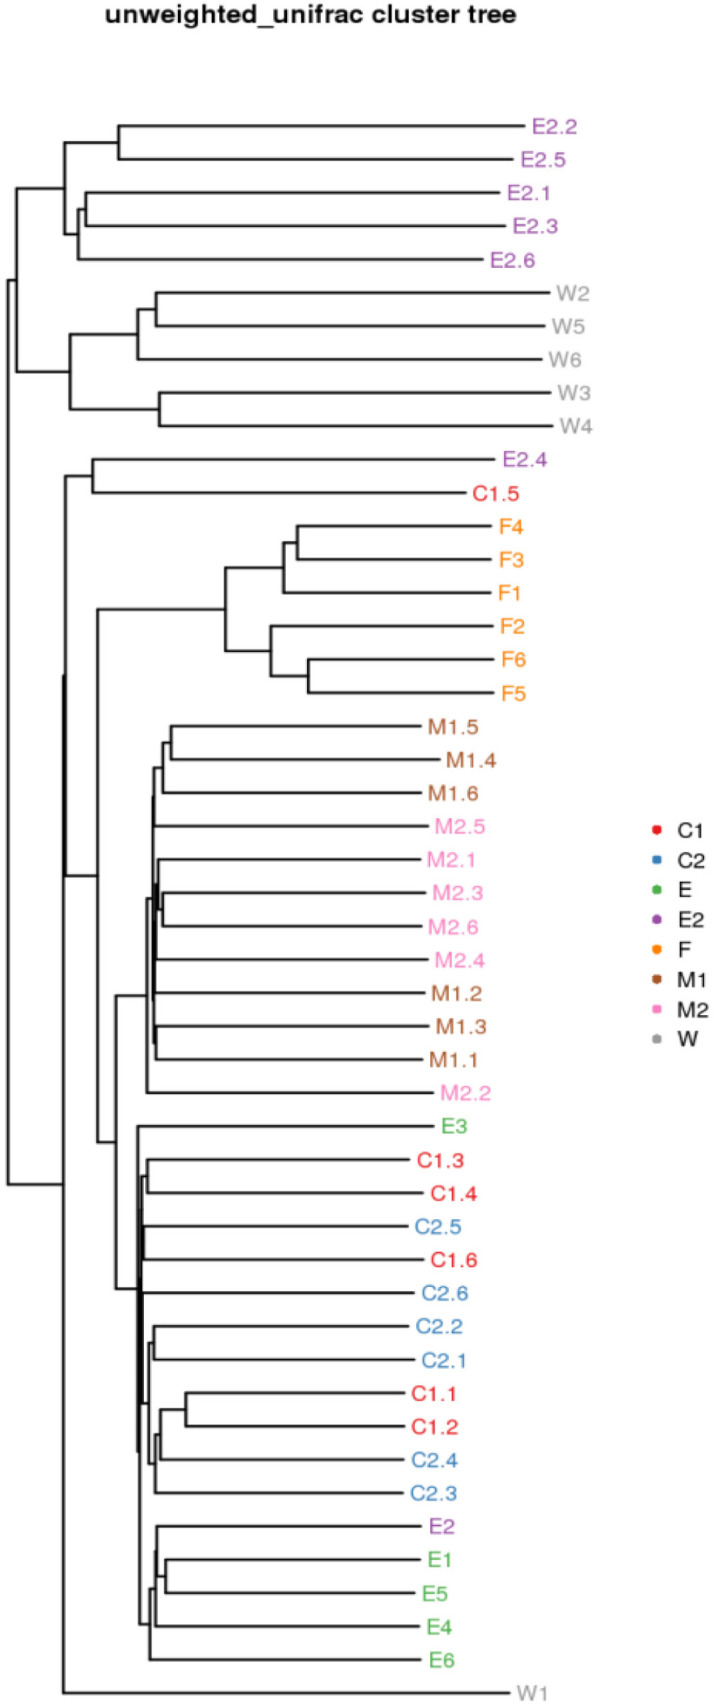
Fig. 5. Samples clustering result (description, weighted_unifrac).

The same color represents the samples in the same group. Short distance between samples represents high similarity. C1, pre-sterilized cow’s teats; C2, post-sterilized cow’s teats; E, milking cluster; M1, milk in storage tank; M2, transport vehicle; E2, storage equipment; F, cow dung samples; W, drinking water.
