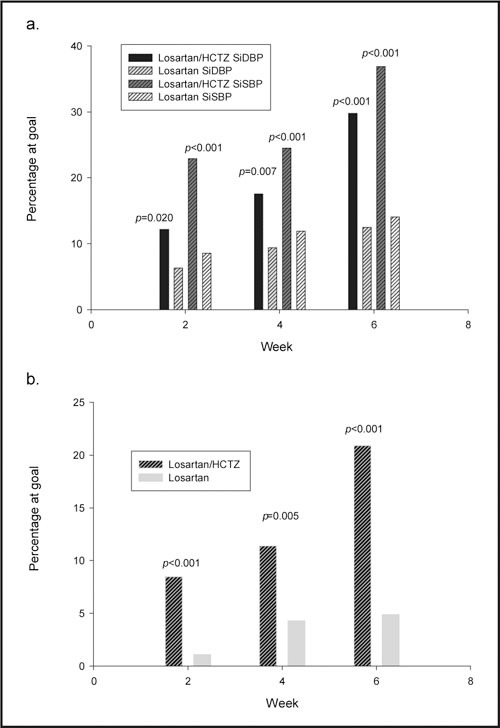
Figure 2.

Graphs of percentage of patients achieving goal. Bar graphs showing percent of patients achieving goal blood pressure. Top graph shows SiDBP and SiSBP at goal (%) at Weeks 2, 4, and 6. Bottom graph shows percentage for both SiDBP and SiSBP at goal (%) at Weeks 2, 4, and 6. SiDBP=sitting diastolic blood pressure <90 mm Hg; SiSBP=sitting systolic blood pressure <140 mm Hg; HCTZ=hydrochlorothiazide
