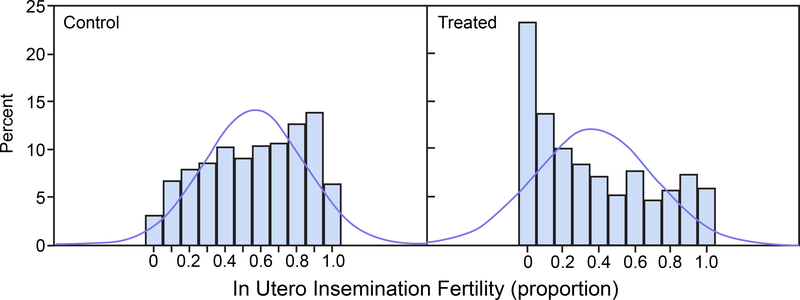
FIGURE 2.
In Utero Insemination Fertility. Histograms of 1,000 simulated beta-distributed random variates with means and standard deviations (SD) as in the control group (left panel) and treated group (right panel). Normal distribution density functions with the same mean and SD are superimposed on the histograms.

