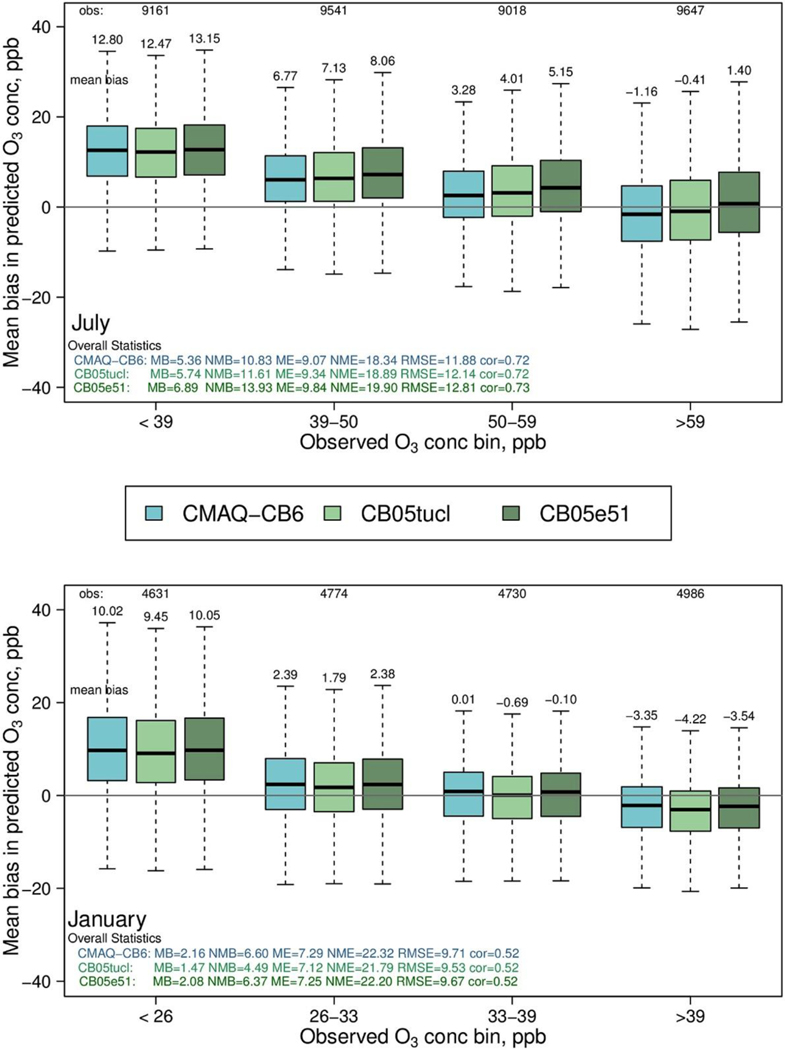
Fig. 2.
Mean bias in daily, maximum 8-h O3 for CMAQ-CB6 and two earlier mechanisms (CB05tucl and CB05e51) in July (top) and January, 2011 (bottom). The number of observations in each concentration bin are given at the top and indicated by relative width of each box; top and bottom of each box denote the 75th and 25th percentiles, respectively, and whiskers denote either the minimum and maximum values or the1.5 × the interquartile range, depending on which is closest to the median.

