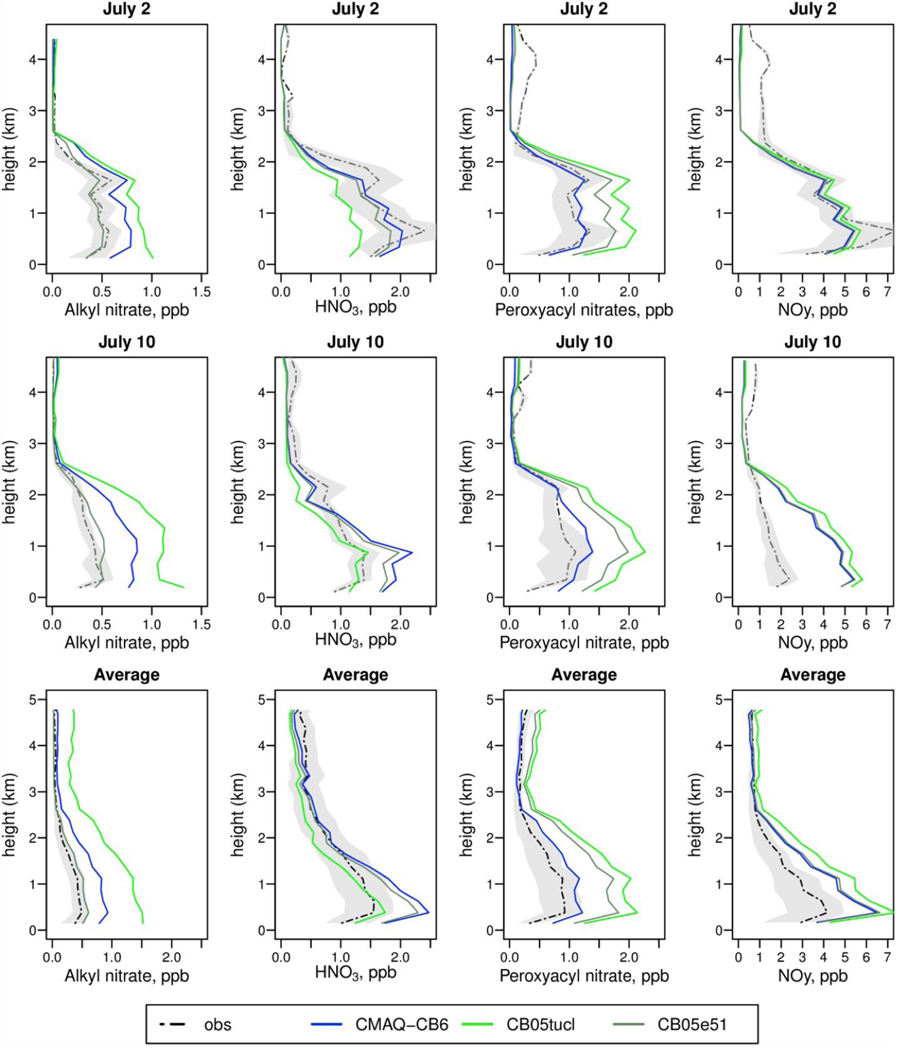
Fig. 5.
Vertical profiles of model predictions for oxidized nitrogen species compared to observations taken during DISCOVER-AQ. Species include alkyl nitrates (leftmost), nitric acid (second from left), peroxyacyl nitrates (second from right) and total NOy (rightmost). Profile dates are July 2 (top) and July 10, 2011 (bottom row). The last row shows the average over all experiment days. Shaded areas show the interquartile range of observations.

