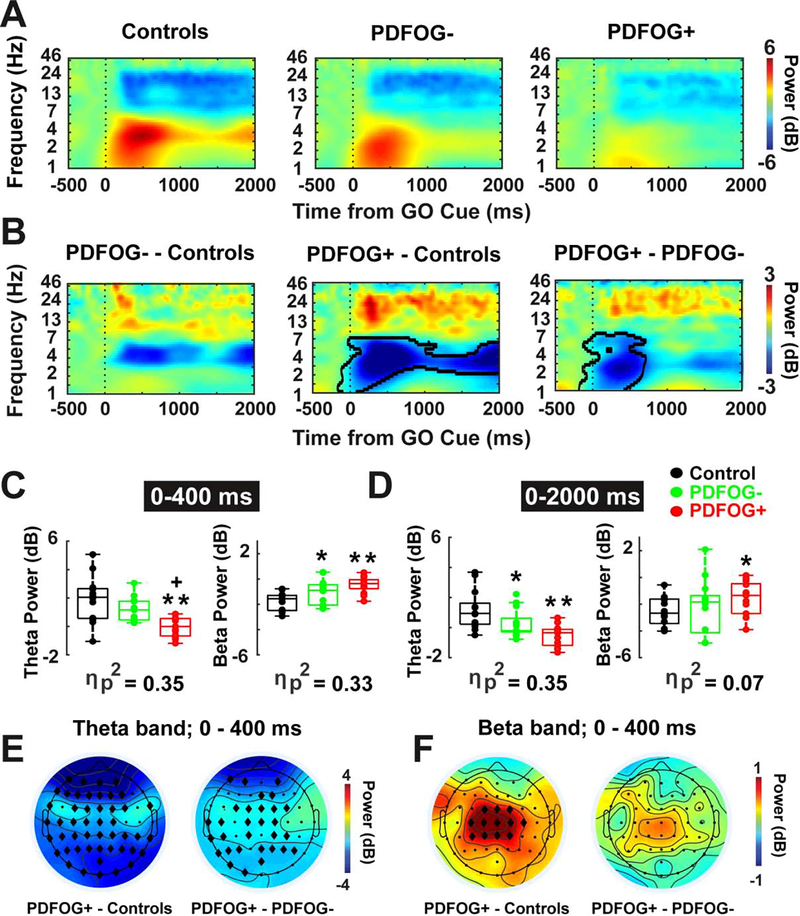
Fig. 3.
FOG is associated with attenuated theta-band and amplified beta-band power in PD. (A-B) Time-frequency analysis showed reduced theta and amplified beta power at frontal scalp electrode (vertex or “Cz”) during pedaling task in PDFOG+ patients as compared to PDFOG− patients and control subjects. PDFOG− patients showed low theta power and high beta power compared to control subjects. (C) Box plots displayed the power values from two tf-ROIs (theta and beta power values at 0–400 ms and 0–2000 ms time windows) during pedaling task. (E-F) Topography plots (PDFOG+ patients versus controls and PDFOG+ patients versus PDFOG− patients) indicated reduced theta and increased beta activity at the frontal region in PDFOG+ patients. B: Permutation-corrected p<0.05 outlined in bold lines. *p<0.05 vs control subjects; **p<0.01 vs control subjects; +p<0.05 vs PDFOG−; Effect size was symbolized by partial eta-squared (ηp2); diamonds show significant electrodes in E and F. FOG: Freezing of Gait; PDFOG+: PD patients with FOG; PDFOG−: PD patients without FOG.

