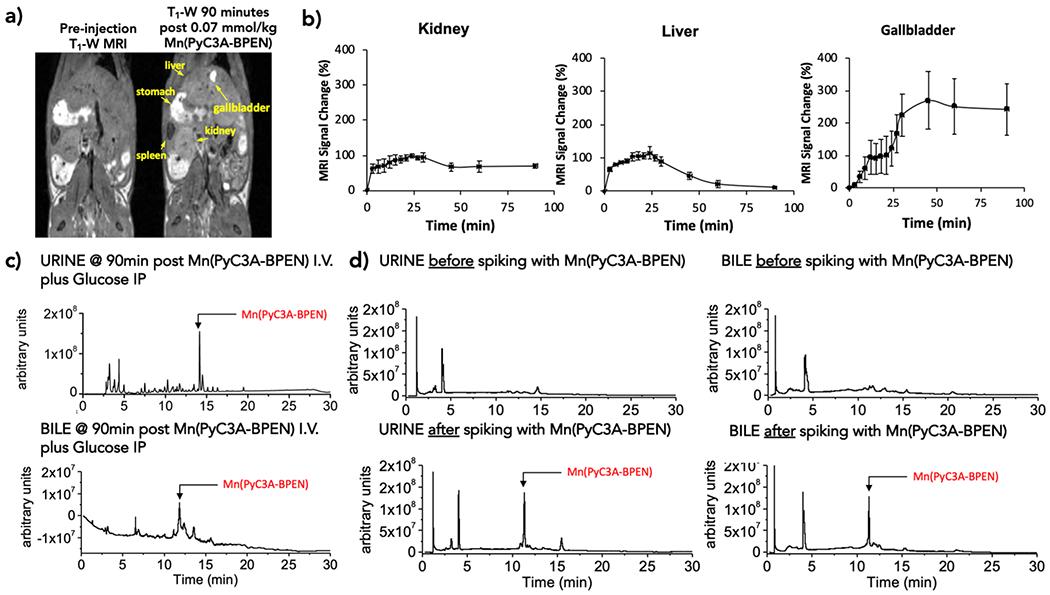
Figure 5.

MnPyC3A–BPEN excretion profiles. (a) Coronal T1-weighted MR images of a mouse pre- and 90 min postinjection of MnPyC3A–BPEN plus glucose. (b) MR signal intensity normalized to muscle for the kidney, liver, and gallbladder as a function of time (N = 4). (c) LC–MS chromatogram of urine and bile collected 90 min postinjection. (d) LC–MS chromatogram of urine and bile before and after spiking with MnPyC3A–BPEN at concentrations measured in urine and bile samples collected 90 min post i.v. injection.
