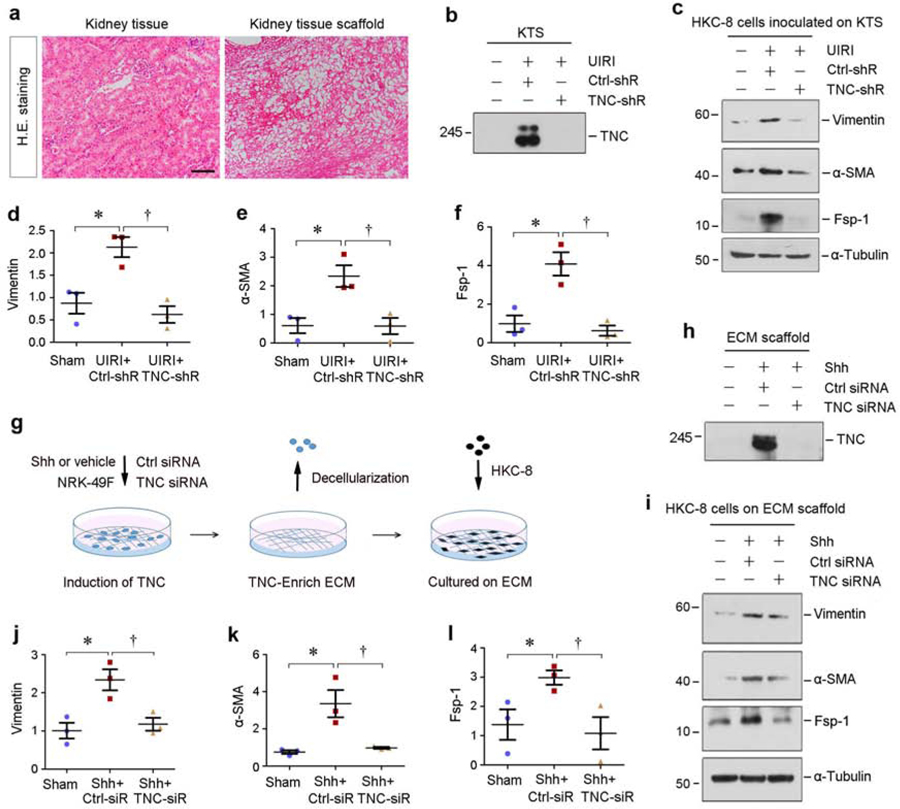
Figure 5. TNC-rich kidney tissue scaffold promotes tubular cells to undergo partial EMT.
(a) Representative micrographs show kidney tissue section and decellularized kidney tissue scaffold (KTS) from mice. Sections were stained with hematoxylin-eosin. Scale bar, 100 µm. (b) Knockdown of TNC resulted in its depletion in the KTS. Representative Western blot analyses show TNC protein levels in the KTS prepared from different groups as indicated. (c-f) TNC-rich KTS facilitates tubular cells to undergo partial EMT ex vivo, whereas TNC-deprived KTS inhibited it. Western blots analyses show the levels of vimentin, α-SMA, Fsp-1 in different groups as indicated. Representative Western blot (c) and quantitative data (d-f) are shown. *P < 0.05 versus sham; †P<0.05 versus control shRNA (n=3). (g) Diagram shows the experimental protocol by which HKC-8 cells are cultured on TNC-enriched ECM scaffold. NRK-49F cells were treated with or without Shh to induce TNC expression in the absence or presence of TNC-siRNA. After three days, the ECM scaffold was then prepared after decellularization with EGTA. HKC-8 cells were inoculated on ECM scaffold for 2 days. (h) TNC abundance in the ECM scaffold was assessed by Western blot analyses after various treatments as indicated. (i-l) TNC-enriched ECM scaffold facilitates tubular cells to undergo partial EMT, whereas TNC-depleted ECM scaffold inhibited it. Western blots analyses show the expression of vimentin, α-SMA and Fsp-1 in different groups as indicated. Representative Western blot (i) and quantitative data (j-l) are shown. *P < 0.05 versus controls; †P < 0.05 versus Ctrl-siRNA (n=3).

