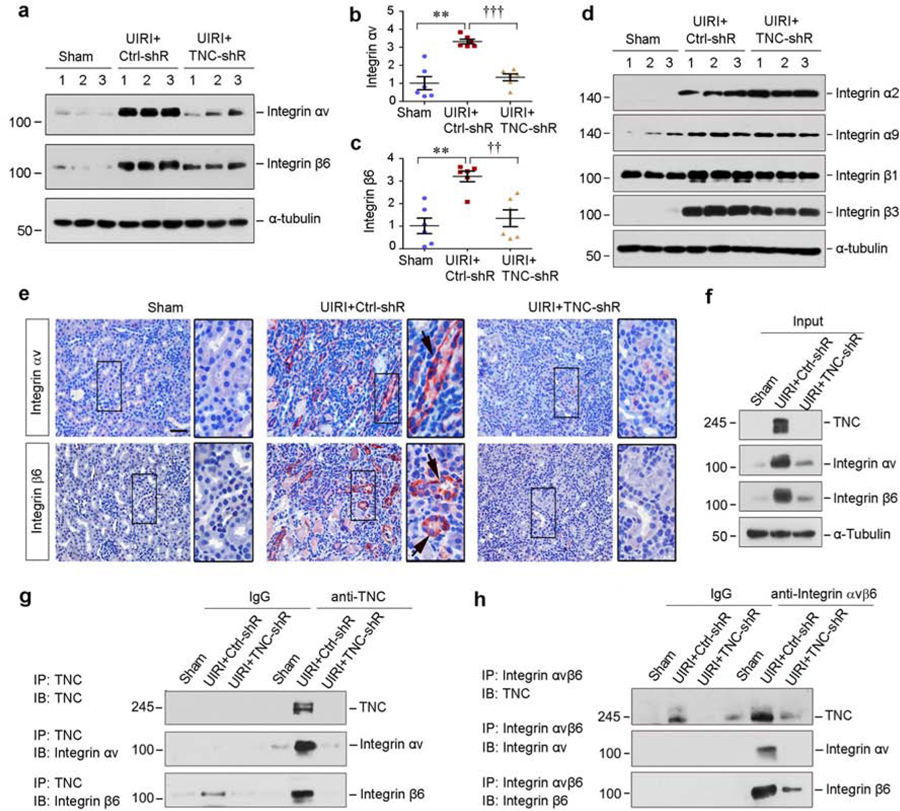
Figure 6. TNC physically interacts with integrin αvβ6.
(a-c) Western blot analyses of renal integrin αv and β6 protein expression at 11 days after IRI in different groups as indicated. Representative Western blot (a) and quantitative data (b and c) are shown. Numbers (1–3) indicate each individual animal in a given group. **P < 0.01, ***P < 0.001 versus sham; †† P < 0.01, ††† P < 0.001 versus control shRNA (n=6). (d) Western blot analyses of renal integrin α2, α9, β1and β3 protein expression at 11 days after IRI in different groups as indicated. Numbers (1–3) indicate each individual animal in a given group. (e) Representative immunohistochemical staining shows renal integrin αv and β6 expression in various groups as indicated. Boxed areas were enlarged. Arrows indicate positive staining. Scale bar, 50 µm. (f-h) Co-immunoprecipitation demonstrates that TNC bound to integrin αvβ6. The lysates from sham and IRI mice injected with control or TNC shRNA were immunoprecipitated (IP) with antibodies against TNC or integrin αvβ6, followed by immunoblotting (IB) with antibodies against TNC, integrin αv, or integrin β6 as indicated.

