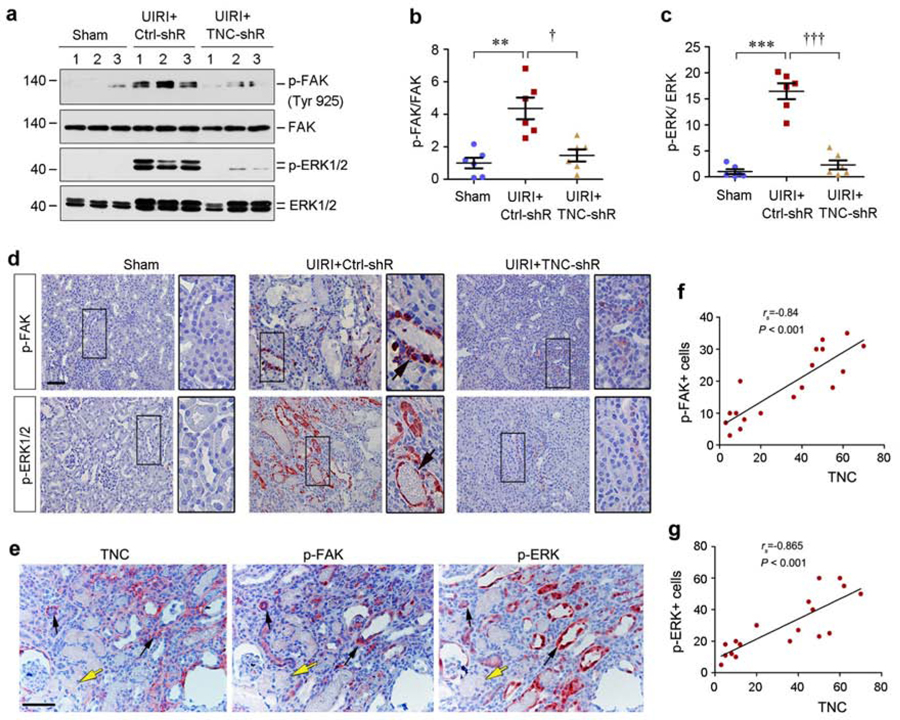
Figure 7. TNC activates integrin downstream FAK/MAPK signaling in vivo.
(a-c) Western blot analyses of renal p-FAK, FAK, p-ERK1/2 and ERK1/2 protein expression at 11 days after IRI in different groups as indicated. Representative Western blot (a) and quantitative data (b and c) are shown. Numbers (1–3) indicate each individual animal in a given group. **P < 0.01, ***P < 0.001 versus sham; † P < 0.05, ††† P < 0.001 versus control shRNA (Ctrl-shR) (n=6). (d) Representative immunohistochemical staining shows renal p-FAK and p-ERK expression in various groups as indicated. Boxed areas were enlarged. Arrows indicate positive staining. Scale bar, 50 µm. (e) Co-localization of TNC, p-FAK and p-ERK in the ischemic kidney at 11 days after UIRI. Series sections of the kidney were immuostained with antibodies against TNC, p-FAK and p-ERK1/2, respectively. Black arrows indicate the area with interstitial expression of TNC and tubular expression of p-FAK and p-ERK, whereas yellow arrows indicate the area with neither TNC nor p-FAK an p-ERK expression. Scale bar, 50 µm. (f, g) Linear regression shows the correlation between renal TNC protein and p-FAK (f) or p-ERK (g). Three images from each animal were taken (with total 6 animals) and protein abundances of TNC and p-FAK or p-ERK were assessed and expressed as positive cells per high power field and plotted. The correlation coefficient is given in the figures.

