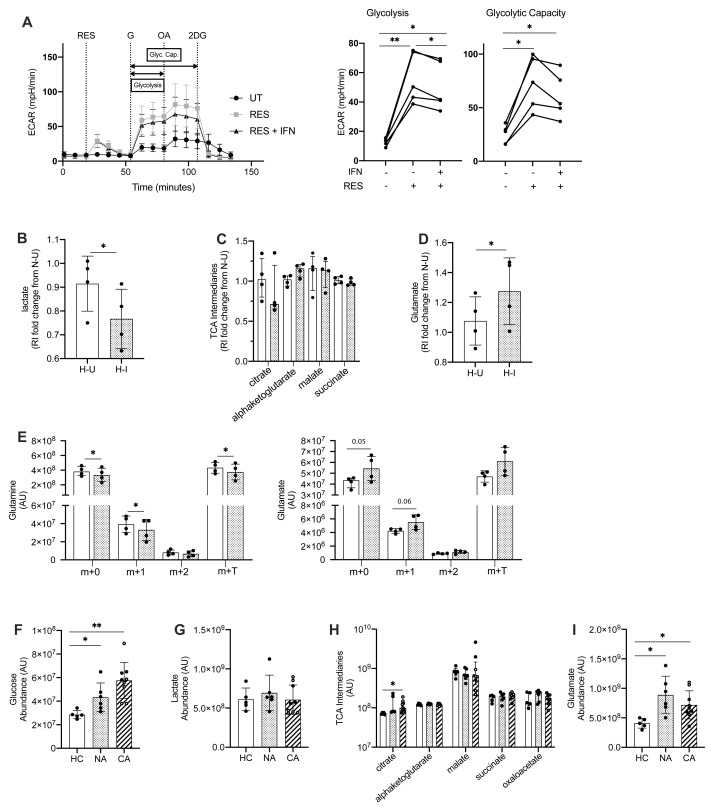
Figure 8. Metabolic rewiring of COVID-19 ARDS neutrophils correspond to changes in neutrophil metabolism in response to type I interferon.
( A) Glycolytic behaviour as determined by extracellular flux analysis during the glycolysis stress test in hypoxia (3% O 2). HC NDN were cultured in hypoxia (1% O 2) with IFNα/ IFNβ (IFN) or without (UT) for 3 h before sequential injections of resiquimod (RES), glucose (G), oligomycin A (OA) and 2-deoxyglucose (2DG) and extracellular acidification rate (ECAR) determined and used to calculate glycolysis and glycolytic capacity (Glyc. Cap.). Data are mean ± SD (n = 5, individual data points represent mean of at least two technical replicates from individual donors). *p < 0.05, **p < 0.01, determined by repeated measures one ANOVA and Tukey’s post hoc-testing. ( B– D) Lactate ( B), TCA intermediaries ( C) and glutamate ( D) abundance in neutrophils cultured in hypoxia for 4 hours with IFNα/ IFNβ (H-I/spotted bars) or without (H-U/open bars) relative to normoxic untreated control cells and determined by hydrophilic interaction liquid chromatography–mass spectrometry (p-HILIC LC-MS). Data are mean ± SD (n = 4, individual data points represent individual donors). *p < 0.05, **p < 0.01 determined by ratio paired t-test. ( E) Glutamine and glutamate isotopomer abundance (Arbitrary Units, AU) as determined by p-HILIC LC-MS in neutrophils cultured as in ( B– D) in the presence of 2 mM U-13C5 glutamine for 4 h. Individual data points represent individual donors, n = 4. Data are mean ± SD. *p<0.05, determined by paired t-test. ( F– I) D-glucose ( F), lactate ( G), TCA intermediary ( H) and glutamate ( I) abundance in normal density neutrophils (NDN) isolated from healthy controls (HC/open bars, n= 5) and patients with non-COVID-19 ARDS (NA/spotted bars, n = 6) or COVID-19 ARDS (CA/diagonal striped bars, n = 9 with six patients receiving dexamethasone treatment indicated by open symbols) was determined by ion pair LC-MS (arbitrary units, AU). Data are mean ± SD ( F, G and I) or median ± I.Q.R ( H). HC, NA and CA were compared by student’s t-test ( F, G and I) or Mann-Whitney ( H) where *p < 0.05 and **p < 0.01.

