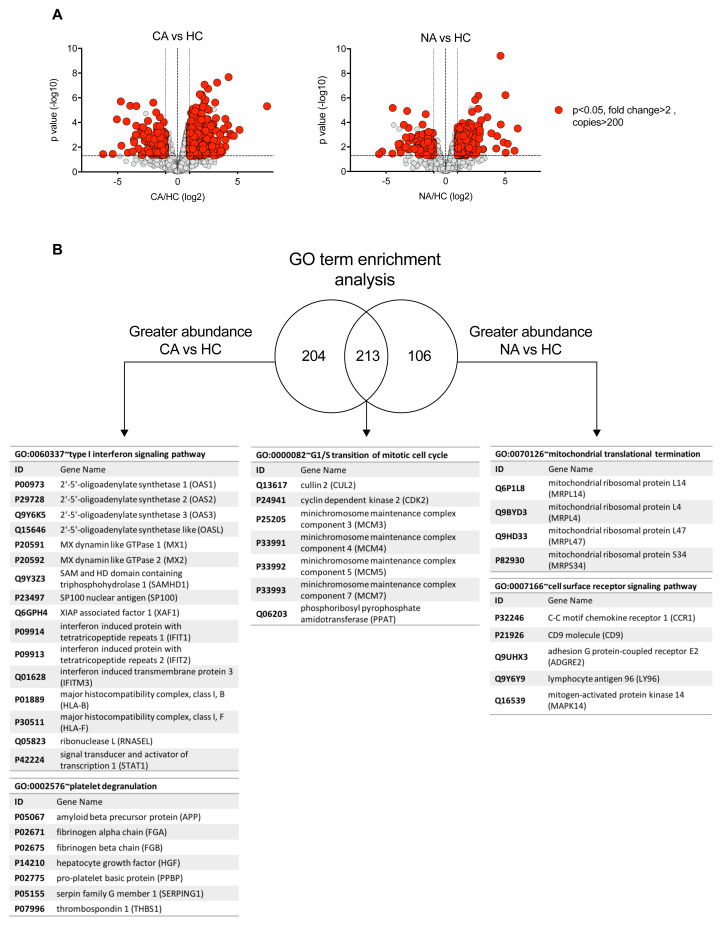
Figure 4. Specific proteome remodelling in circulating neutrophils in response to COVID-19 ARDS and ARDS.
( A) Volcano plots obtained from proteomic survey of normal density neutrophils (NDN) isolated from healthy controls (HC, n = 4), non-COVID-19 ARDS patients (NA, n = 6) and COVID-19 ARDS patients (CA, n = 7). Refer to methods section for details. Proteins with a P value <0.05 (horizontal dashed lines), fold change >2 (outer vertical dashed lines) and a copy number >200 in at least one condition after Linear Models for Microarray data analysis were considered as significantly different in the comparisons CA vs HC (left) and NA vs HC (right). ( B) GO term enrichment analysis for proteins significantly increased in abundance in CA and NA patients vs HC. Venn diagram shows the numbers of proteins uniquely increased in abundance in CA and NA and also the number of proteins shared between these two groups. A selection of the top enriched GO terms and the corresponding proteins are shown.

