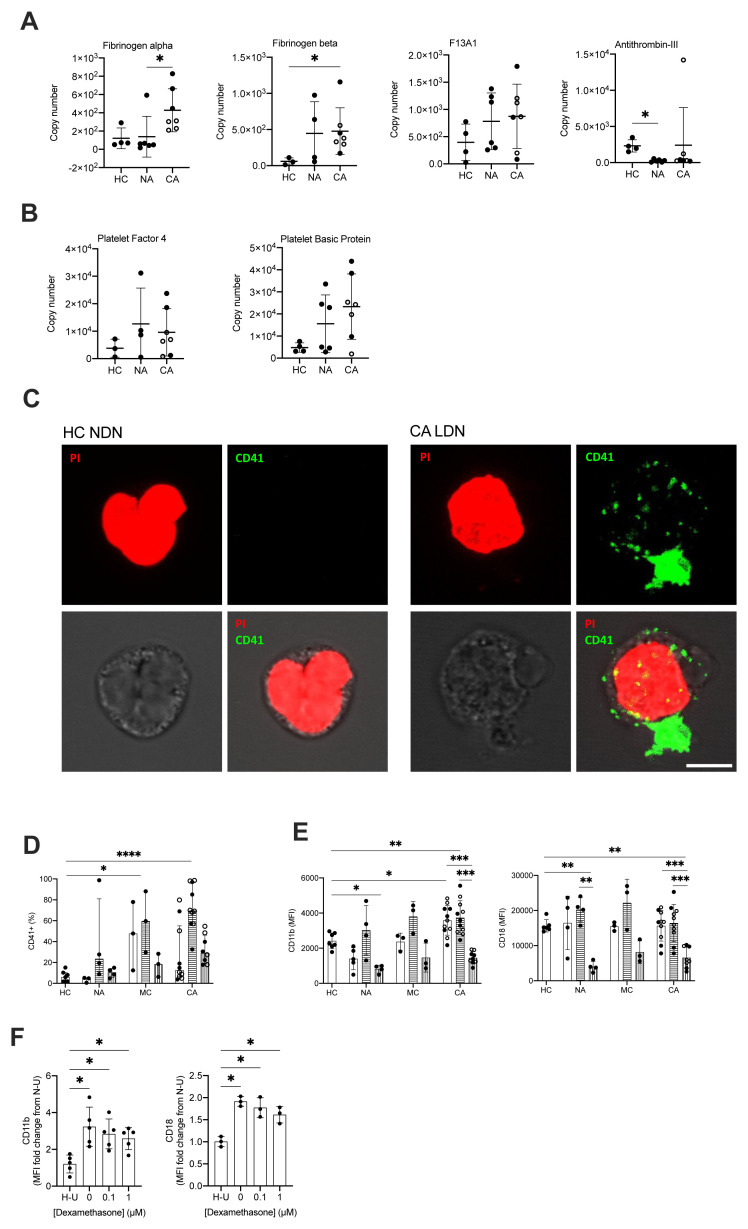
Figure 5. COVID-19 ARDS neutrophils form aggregates with platelets and activate prothrombotic pathways.
( A) Copy numbers of proteins that regulated fibrin clot formation in normal density neutrophils (NDN) isolated from healthy controls (HC, n = 3–4), non-COVID-19 ARDS (NA, n = 4–6), and COVID-19 ARDS (CA, n = 7, with open circles depicting the data corresponding to dexamethasone-treated patients) patients determined by proteomic analysis. For fibrinogen alpha, fibrinogen beta and antithrombin-III, data as mean ± SD, *p < 0.05, determined by Kruskal-Wallis and Dunn’s post hoc-testing. For coagulation factor XIII alpha chain (F13A), data as mean ± SD. ( B) Copy numbers of proteins associated with platelets in the same samples described in ( A) determined by proteomic analysis. Data as mean ± SD. ( C) Representative confocal images from NDN obtained from a healthy donor and LDN from a CA patient isolated by fluorescence-activated cell sorting (FACS) and stained for propidium iodide (top left panel, red) and CD41 (top right panel, green). Bright field image was used to delimit cell contour (bottom left panel, grey scale). A composite image is shown in bottom right panel. Scale bar corresponds to 5 μm, 63x magnification. ( D) Percentage of NDN (open bars), mature LDN (horizontal striped bars) and immature LDN (vertical striped bars) isolated from HC (n = 6–7), NA (n = 3-5), MC (n = 3) or CA patients (n = 8–11; open circles depict dexamethasone treated patients) with surface expression of CD41. Data are median ± I.Q.R. *p < 0.05, ****p < 0.0001 vs. HC, determined be Kruskal-Wallis and Dunn’s post hoc-testing. ( E) Surface expression of CD11b and CD18 (Mac-1 complex) displayed as geometric mean fluorescence intensity (MFI) determined by flow cytometry analysis of neutrophil populations described in ( D). Data are mean ± SD. **p < 0.01, ***p < 0.001, determined by repeated measures two-way ANOVA and Sidak’s post hoc-testing; *p < 0.05, **p < 0.01 vs. HC, determined be one-way ANOVA and Holm-Sidak’s post hoc-testing. ( F) Surface expression of CD11b and CD18 (Mac-1 complex) expressed as a fold change of MFI of HC NDN cultured under untreated normoxic conditions ( N– U) determined by flow cytometry analysis of HC NDN cultures in hypoxia under untreated conditions ( H– U) or with varying doses of dexamethasone for 3 h and follow-up treatment with resiquimod for 1 h. Data are mean ± SD (n = 3–5). *p < 0.05, determined by repeated measures one-way ANOVA and Holm-Sidak’s post hoc-testing.

