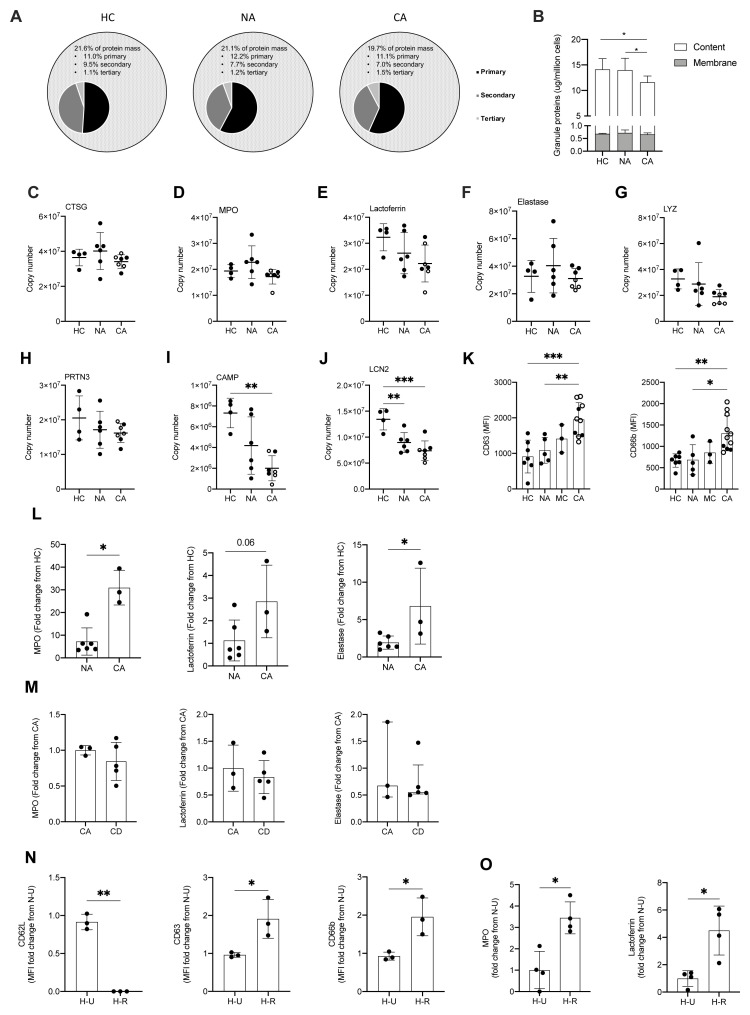
Figure 6. Enhanced circulating neutrophil degranulation in COVID-19.
( A) Pie charts show distribution of protein mass for proteins integrating primary, secondary or tertiary granules in healthy control (HC, n = 4), non-COVID-19 ARDS (NA, n = 6) and COVID-19 ARDS (CA, n = 7) patients. Data obtained from proteomic analysis of normal density neutrophils (NDN). ( B) Membrane (grey bars) and content (white bars) granule cargo protein abundance in NDN isolated from the samples described in ( A). Data are mean ± SD. *p < 0.05, determined by two-way ANOVA and Tukey’s post hoc-testing. ( C– J) Copy numbers of granule proteins in the samples described in (A, open circles depict dexamethasone-treated patients). For ( C– E), data are mean ± SD. For ( F– J), data are mean ± SD. **p < 0.01, determined be one-way ANOVA and Holm-Sidak’s post hoc-testing. ( K) Surface expression of CD63 and CD66b displayed as mean fluorescence intensity (MFI) determined by flow cytometry analysis of NDN isolated from HC (n = 7), NA (n = 5), moderate COVID-19 (MC, n = 3) and CA (n = 12, open circles depict dexamethasone-treated patients) patients. For CD63, data are mean ± SD. **p < 0.01, ***p < 0.001, determined be one-way ANOVA and Holm-Sidak’s post hoc-testing. For CD66b, data are median ± I.Q.R. *p < 0.05, **p < 0.01, determined by Kruskal-Wallis and Dunn’s post hoc-testing. ( L) Granule protein levels in serum of NA (n = 6), and CA (n = 3) patients measured by ELISA represented as a fold change from HC. For myeloperoxidase (MPO), data are median ± I.Q.R. *p < 0.05, determined by Mann-Whitney test. For elastase, data are mean ± SD. *p < 0.05, determined by unpaired t-test. ( M) Granule protein levels in serum of CA (n = 3), and COVID-19 ARDS dexamethasone-treated (CD, n = 5) patients measured by ELISA represented as a fold change from CA. For MPO and lactoferrin, data are mean ± SD. For elastase, data are median ± I.Q.R. ( N) Surface expression of activation markers expressed as a fold change of MFI of HC NDN under untreated normoxic conditions ( N– U) determined by flow cytometry analysis of HC NDN cultures in hypoxia under untreated conditions ( H– U) or with resiquimod ( H– R) for 1 h. Data are mean ± SD. *p < 0.05, **p < 0.01, determined by paired one-tailed t-test. ( O) Granule protein levels measured in H-U and H-R HC NDN culture supernatants at 4 h by ELISA expressed as a fold change of a N-U group. Data are mean ± SD. *p < 0.05, determined by paired t-test.

