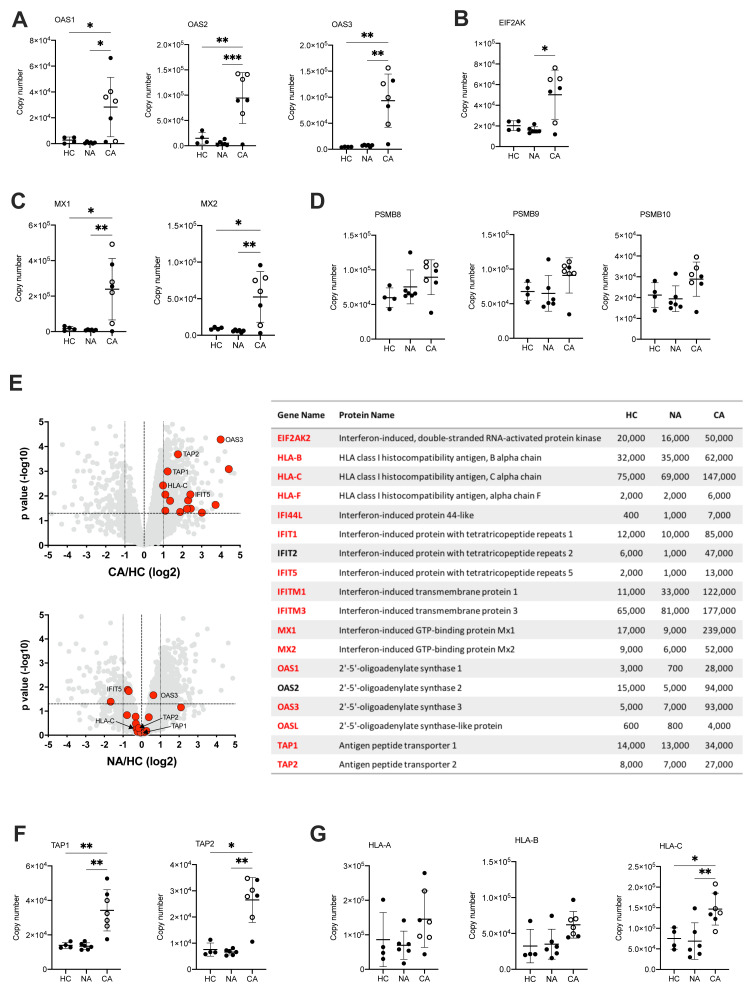
Figure 7. Activation of neutrophil type I interferon signalling pathways and antigen presentation in COVID-19.
( A) Copy numbers of 2’,5’-oligoadenylate synthetase (OAS) proteins involved in type I IFN signalling and anti-viral responses in normal density neutrophils (NDN) isolated from healthy controls (HC, n = 4), non-COVID-19 ARDS (NA, n = 6) and COVID-19 ARDS (CA, n = 7, open circles depicting dexamethasone-treated patients) patients determined by proteomic analysis. Data are mean ± SD. *p < 0.05, **p < 0.01, ***p < 0.001, determined by one-way ANOVA and Holm-Sidak’s post hoc-testing. ( B) Copy numbers of EIF2AK in the same samples described in ( A). Data are mean ± SD. *p < 0.05, determined by Kruskal-Wallis and Dunn’s post hoc-testing. ( C) Copy numbers of Mx proteins in the same samples described in ( A). Data are mean ± SD. *p < 0.05, **p < 0.01, determined by one-way ANOVA and Holm-Sidak’s post hoc-testing. ( D) Copy numbers of PSMB proteins in the same samples described in ( A). Data are mean ± SD. ( E) Volcano plots (left) obtained from proteomic survey of normal density neutrophils (NDN) isolated from the samples described in ( A) including a selection of proteins implicated in antigen processing and presentation and interferon signalling (GO:0002376) highlighted in red and with some of them labelled as illustrative examples. Refer to methods section for details. Proteins with a P value <0.05 (horizontal dashed lines), fold change >2 (outer vertical dashed lines) and a copy number >200 in at least one condition after Linear Models for Microarray data analysis were considered as significantly different in the comparisons CA vs HC (top) and NA vs HC (bottom). Table (right) includes a selection of proteins from the samples described in ( A) involved in antigen processing and presentation or interferon signalling which significantly change in abundance in CA vs. HC (>2 fold change, p<0.05). Proteins highlighted in red show a COVID-19 specific signature and did not significantly change in non-COVID-19 ARDS alone. Mean copy numbers are shown. ( F) Copy numbers of Transporter Associated with Antigen Processing (TAP) proteins in the same samples described in ( A). For TAP-1, data are mean ± SD. **p < 0.01, determined by one-way ANOVA and Holm-Sidak’s post hoc-testing. For TAP-2, data are mean ± SD. *p < 0.05, **p < 0.01, determined by Kruskal-Wallis and Dunn’s post hoc-testing. ( G) Copy numbers of major histocompatibility complex molecules in the same samples described in ( A). Data are mean ± SD. *p < 0.05, **p < 0.01 determined by one-way ANOVA and Holm-Sidak’s post hoc-testing.

